Energy Efficiency Trends in Canada
![]()
The Office of Energy Efficiency at Natural Resources Canada has changed the base year from 1990 to 2000. This change was made to ensure that our data reflects developments in trends and structures of Canada’s energy end use and efficiency across sectors. It also synchronizes reporting on Canada’s energy use data with changes made by the International Energy Agency.
Highlights
- Energy efficiency improved 12.8%, saving Canadians 846.6 PJ in energy and $20.7 billion in costs. Secondary energy use (final energy demand) in Canada increased 9.6%. It would have increased 20.2% without energy efficiency improvements.
- Energy efficiency helped avoid 45.5 Mt in GHG emissions.
- Canada’s energy intensity per unit of Gross Domestic Product (GDP) improved 21.3%.
Economic Impacts of COVID-19 in 2020
The COVID-19 pandemic negatively affected the Canadian economy, leading to an increase in unemployment and a sharp decline in GDP. The following evidence shows the severity of the impacts of COVID-19.
The annual changes in 2020 compared to 2019
- Total secondary energy use declined by 8.9%.
- GDP declined by 5%.
- Total employment fell by 5.6%. The services sector contributed 82.5% to the total loss of employment.
- The unemployment rate jumped to 9.7% from 5.7% the previous year.
 Energy use
Under the Energy Efficiency Act (SC 1992, c.36) , the Office of Energy Efficiency is mandated to measure, analyze and report on changes to secondary energy demand (i.e., energy efficiency improvements) in an annual report to Parliament.
Primary and secondary energy use (final energy use) by sector, 2020
Text version
Primary and secondary energy use (final energy use) by sector, 2020
| Percentage | |||||||||||
|---|---|---|---|---|---|---|---|---|---|---|---|
| Energy losses, feed stock, producer consumption and pipeline | 29 | ||||||||||
| Secondary energy use | 71 | ||||||||||
|
|||||||||||
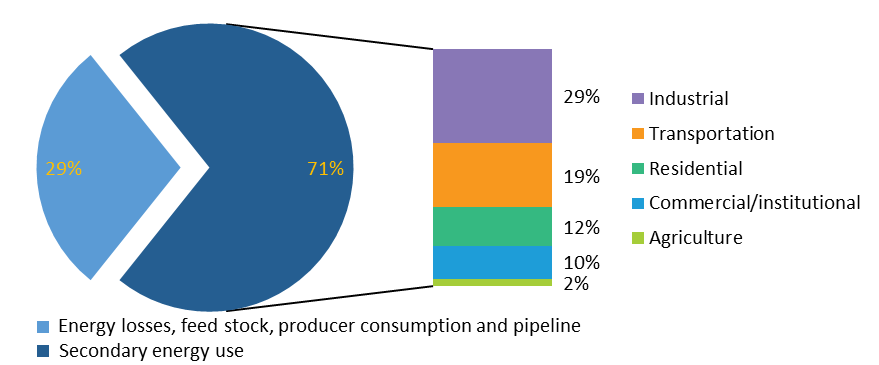
- Secondary (or end-use) energy is the energy used directly by final consumers in various sectors of the economy. This kind of energy includes electricity, natural gas, and refined petroleum products required to heat and cool homes or businesses in the residential and commercial/institutional sectors, the energy used by vehicles in the transportation sector, and the energy required to run machinery in the industrial and agricultural sectors. Secondary energy use accounted for 71.5% of the primary energy use in 2020, which equals 8,817.7 PJ.
- Primary (or total) energy encompasses the total requirements for all users of energy, including secondary energy use. Primary energy use refers to the energy required to transform one form of energy to another (e.g. coal to electricity). The energy used to bring energy supplies to the consumer (e.g. through a pipeline) are also included. Further, it includes the energy used to feed industrial production processes (e.g. the natural gas used as feedstock by the chemical industries). In 2020, the total amount of primary energy consumed was 12,339.1 PJ.

Text version
Secondary energy use by sector, 2020
| Distribution of energy use | Percentage |
|---|---|
| Residential | 16.2 |
| Commercial/institutional | 13.8 |
| Industrial | 39.9 |
| Transportation | 26.8 |
| Agriculture | 3.3 |
The industrial sector used 3,518.2 PJ of energy, which accounted for 40% of Canada’s total secondary energy use, the most by any sector. The transportation sector had the second highest energy use (2,365.7 PJ). Historically for the period 2000-2019, the transportation sector’s average share of energy use had been about 29%, but this sector was significantly impacted by COVID-19 in 2020. Consequently, the sector’s energy use decreased by 17.3% from 2019 levels. This 496 PJ decrease caused its share to fall to a historical low of 26.8%.
Text version
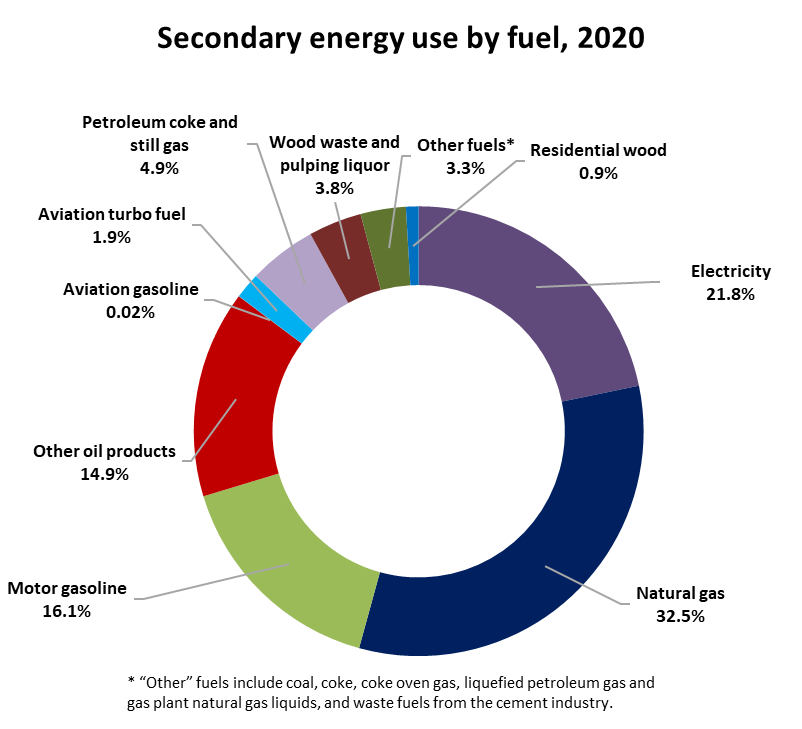
Secondary energy use by fuel type, 2020
| Distribution of energy use | Percentage |
|---|---|
| Electricity | 21.8 |
| Natural gas | 32.5 |
| Motor gasoline | 16.1 |
| Other oil products | 14.9 |
| Aviation gasoline | 0.02 |
| Aviation turbo fuel | 1.9 |
| Petroleum coke and still gas | 4.9 |
| Wood waste and pulping liquor | 3.8 |
| Other fuels Footnote * | 3.3 |
| Residential wood | 0.9 |
Text version
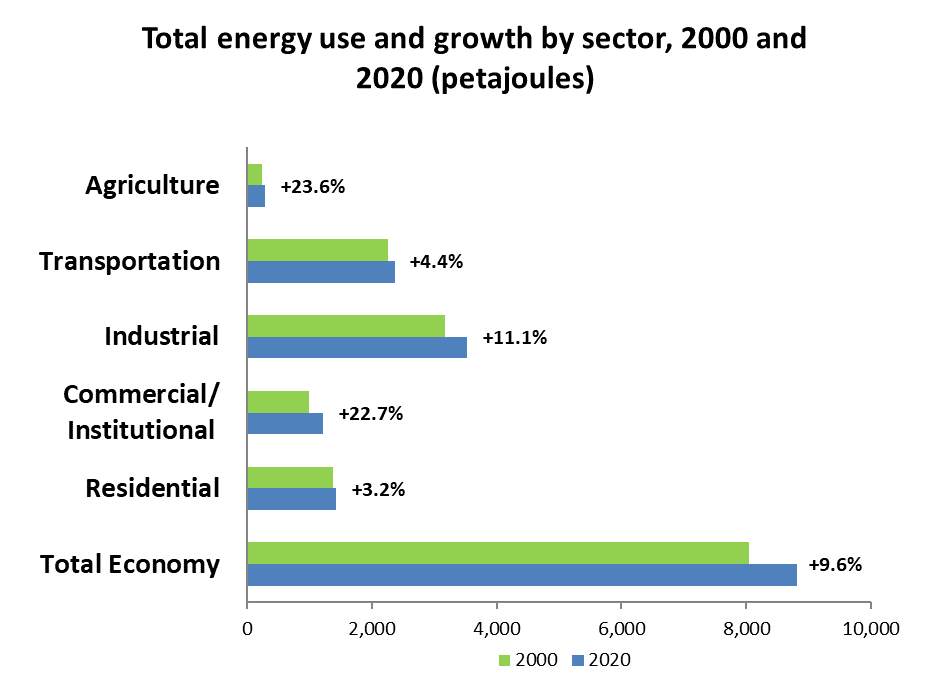
Total energy use and growth by sector, 2000 and 2020 (petajoules)
| 2000 | 2020 | Growth/decrease (%) | |
|---|---|---|---|
| Residential | 1,384 | 1,428 | 3.2 |
| Commercial/Institutional | 990 | 1,216 | 22.7 |
| Industrial | 3,167 | 3,518 | 11.1 |
| Transportation | 2,266 | 2,365 | 4.4 |
| Agriculture | 235 | 290 | 23.6 |
| Total Economy | 8,042 | 8,818 | 9.6 |
 Energy intensity
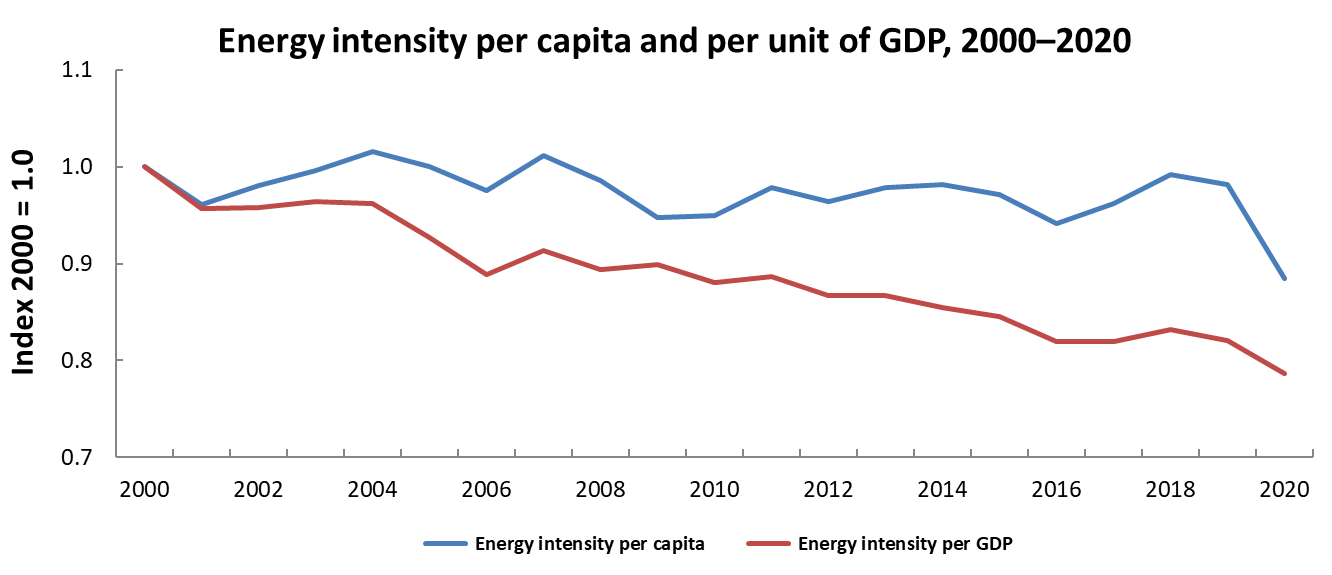
Energy intensity Footnote 1 compares the energy used relative to the output of the system, often economic output in terms of GDP. Energy efficiency describes how effectively the energy used was converted to useful energy. Energy Intensity Improvement measures the reduction in energy used per unit of economic output (i.e. the change in Energy/GDP).
Overall, both energy intensity and energy efficiency trends tend to behave similarly, however they are two distinctly different measures of an economy’s energy performance Footnote 2 . Therefore, energy intensity improvements can diverge from energy efficiency improvements which are driven solely by technological changes/efficiency programs. For example, in the year 2020-2021 following the pandemic, energy intensity improvement increased dramatically, owing to a quick economic recovery (5% GDP growth), while energy efficiency decreased. This example underscores the challenge of addressing energy intensity from a policy perspective due to the inability to control externalities that will impact the index.
Natural Resources Canada has developed a more sophisticated and internationally recognized factorization analysis to estimate actual energy efficiency improvements more accurately (see Energy Efficiency section). This analysis disaggregates the multiple factors contributing to energy use.
Text version
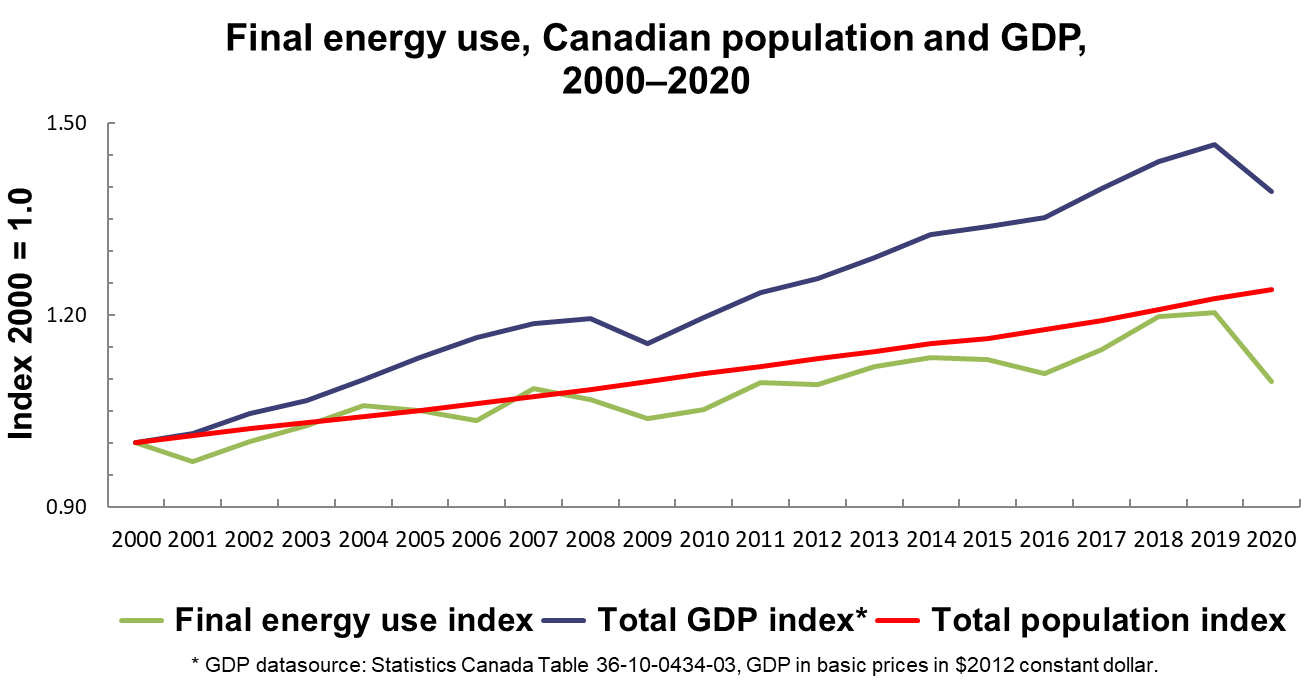
Final energy use, Canadian population and GDP, 2000–2020 (Index 2000=1)
| Final energy use index | Total GDP index Footnote * | Total population index | |
|---|---|---|---|
| 2000 | 1.00 | 1.00 | 1.00 |
| 2001 | 0.97 | 1.02 | 1.01 |
| 2002 | 1.00 | 1.05 | 1.02 |
| 2003 | 1.03 | 1.07 | 1.03 |
| 2004 | 1.06 | 1.10 | 1.04 |
| 2005 | 1.05 | 1.13 | 1.05 |
| 2006 | 1.04 | 1.16 | 1.06 |
| 2007 | 1.08 | 1.19 | 1.07 |
| 2008 | 1.07 | 1.19 | 1.08 |
| 2009 | 1.04 | 1.16 | 1.10 |
| 2010 | 1.05 | 1.20 | 1.11 |
| 2011 | 1.09 | 1.23 | 1.12 |
| 2012 | 1.09 | 1.26 | 1.13 |
| 2013 | 1.12 | 1.29 | 1.14 |
| 2014 | 1.13 | 1.33 | 1.15 |
| 2015 | 1.13 | 1.34 | 1.16 |
| 2016 | 1.11 | 1.35 | 1.18 |
| 2017 | 1.15 | 1.40 | 1.19 |
| 2018 | 1.20 | 1.44 | 1.21 |
| 2019 | 1.20 | 1.47 | 1.23 |
| 2020 | 1.10 | 1.39 | 1.24 |
In Canada, energy intensity improved 21.3% between 2000 and 2020, reflecting a significant improvement in how effectively Canadians used energy to produce GDP.
Text version
Energy intensity per capita and per unit of GDP, 2000–2020 (Index 2000=1.0)
| Energy intensity per capita | Energy intensity per GDP | |
|---|---|---|
| 2000 | 1.00 | 1.00 |
| 2001 | 0.96 | 0.96 |
| 2002 | 0.98 | 0.96 |
| 2003 | 1.00 | 0.96 |
| 2004 | 1.02 | 0.96 |
| 2005 | 1.00 | 0.93 |
| 2006 | 0.98 | 0.89 |
| 2007 | 1.01 | 0.91 |
| 2008 | 0.99 | 0.89 |
| 2009 | 0.95 | 0.90 |
| 2010 | 0.95 | 0.88 |
| 2011 | 0.98 | 0.89 |
| 2012 | 0.96 | 0.87 |
| 2013 | 0.98 | 0.87 |
| 2014 | 0.98 | 0.85 |
| 2015 | 0.97 | 0.84 |
| 2016 | 0.94 | 0.82 |
| 2017 | 0.96 | 0.82 |
| 2018 | 0.99 | 0.83 |
| 2019 | 0.98 | 0.82 |
| 2020 | 0.88 | 0.79 |
 Energy efficiency
The International Energy Agency denotes energy efficiency as the world’s “first fuel of economic development”. Energy efficiency has multiple economic and environmental benefits, including being the cheapest option to reduce GHG emissions.
Text version
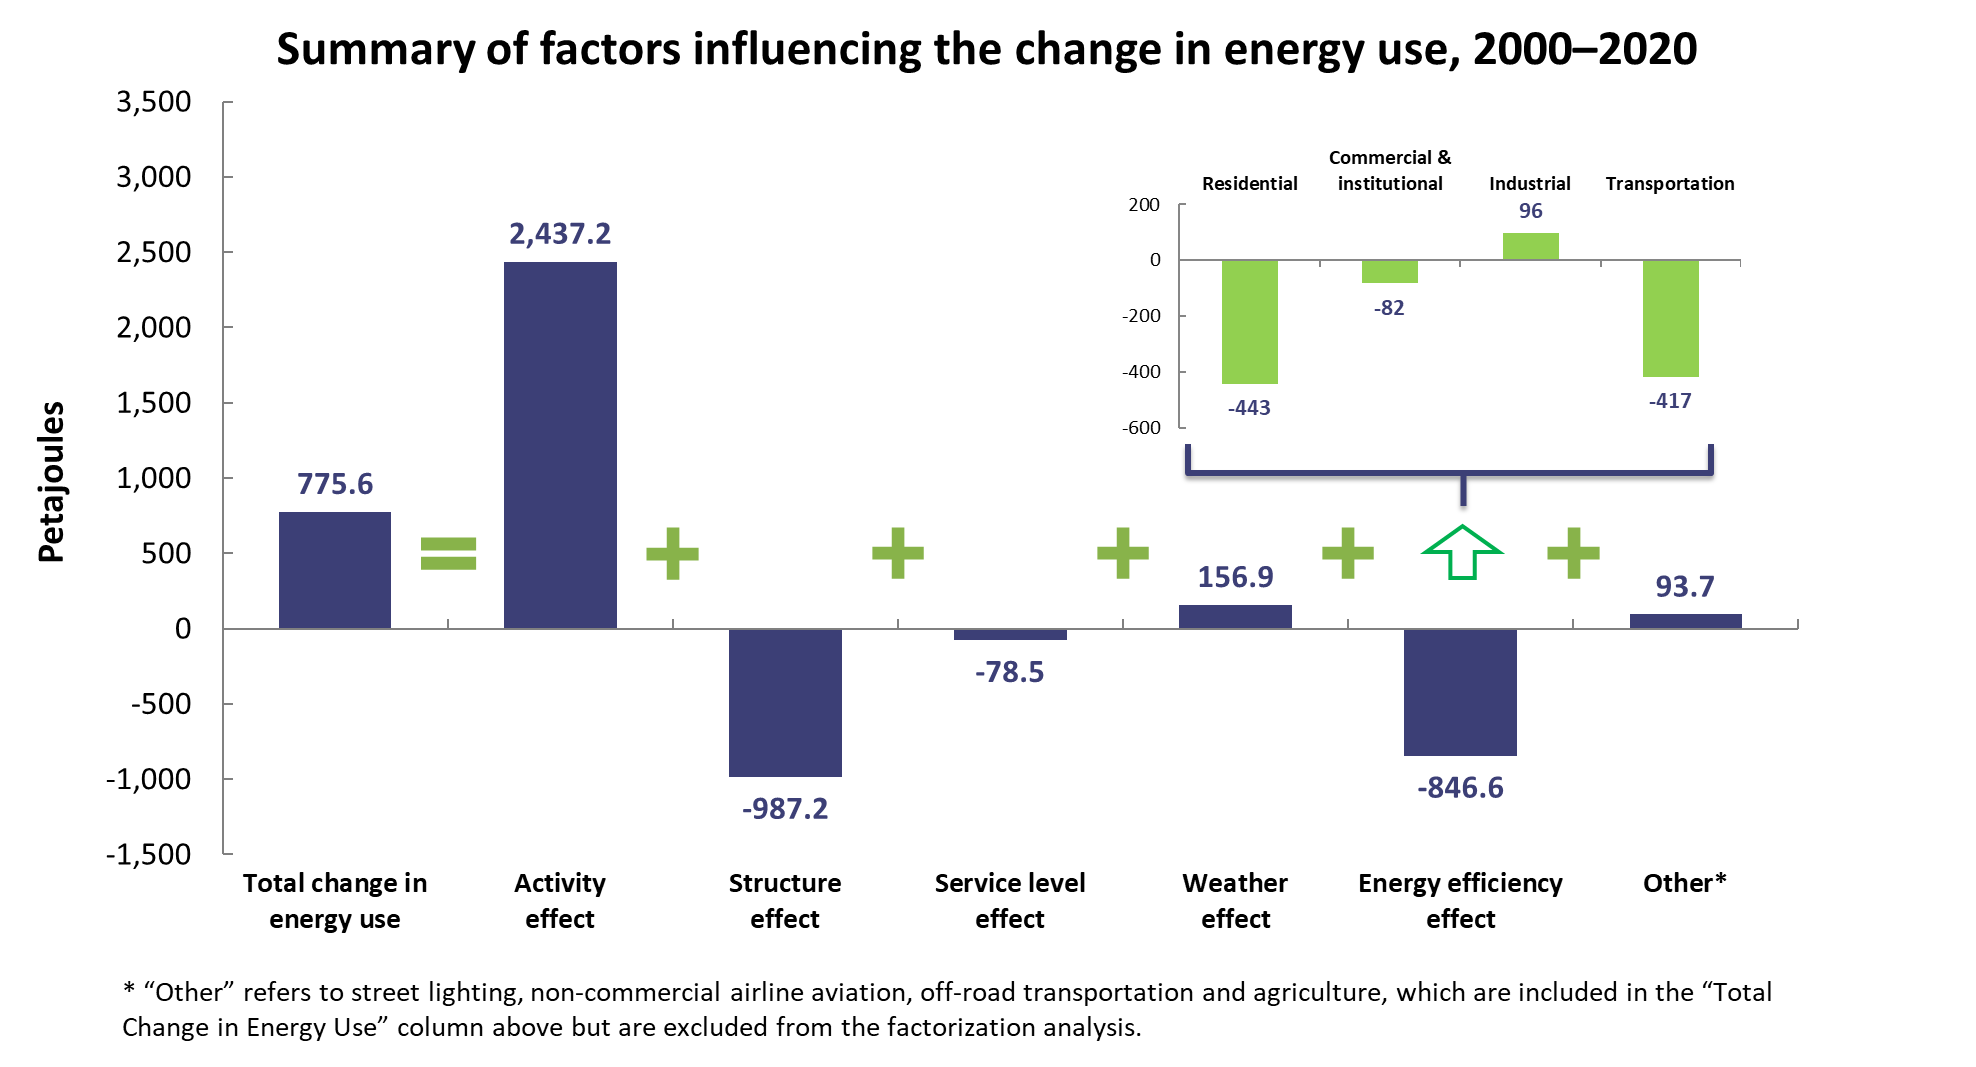
Summary of factors influencing the change in energy use, 2000–2020
| Petajoules | |
|---|---|
| Total change in energy use | 775.6 |
| Activity effect | 2,437.2 |
| Structure effect | -987.2 |
| Service level effect | -78.5 |
| Weather effect | 156.9 |
| Energy efficiency effect | -846.6 |
| Other Footnote * | 93.7 |
Natural Resources Canada (NRCan) isolates and tracks the amount of energy saved through energy efficiency by identifying and measuring other factors that impact energy use:
- The activity effect is the increase in energy use caused by economic growth, which resulted in an increase of 2,437.2 PJ in energy use and 116.0 Mt in GHG emissions.
- The structure effect is how the changing composition of the economy influences energy use. For example, some industries may have growing subsectors that are more or less energy-intensive than others. The structural changes in the Canadian economy resulted in a decrease of 987.2 PJ in energy and 41.3 Mt in GHG emissions.
- The weather effect measures the impact of hotter or colder temperatures on energy use over time. In 2020, the winter was warmer and the summer was much hotter than in 2000, resulting in a decrease of 78.5 PJ in energy and 3.2 Mt in GHG emissions.
- The service level effect measures the increased use of equipment in homes and businesses. As information technology use has increased across industries and sectors of the economy, energy use has increased both at home and at work. The changes in service level resulted in an increase of 156.9 PJ in energy use and 6.4 Mt in GHG emissions.
- The energy efficiency effect is the balance of the total change in energy use over time (2000–2020) minus the impact of the identified factors above. In 2020, the 12.8% improvement in energy efficiency for the Canadian economy saved 846.6 PJ in energy and avoided 45.5 Mt in GHG emissions.
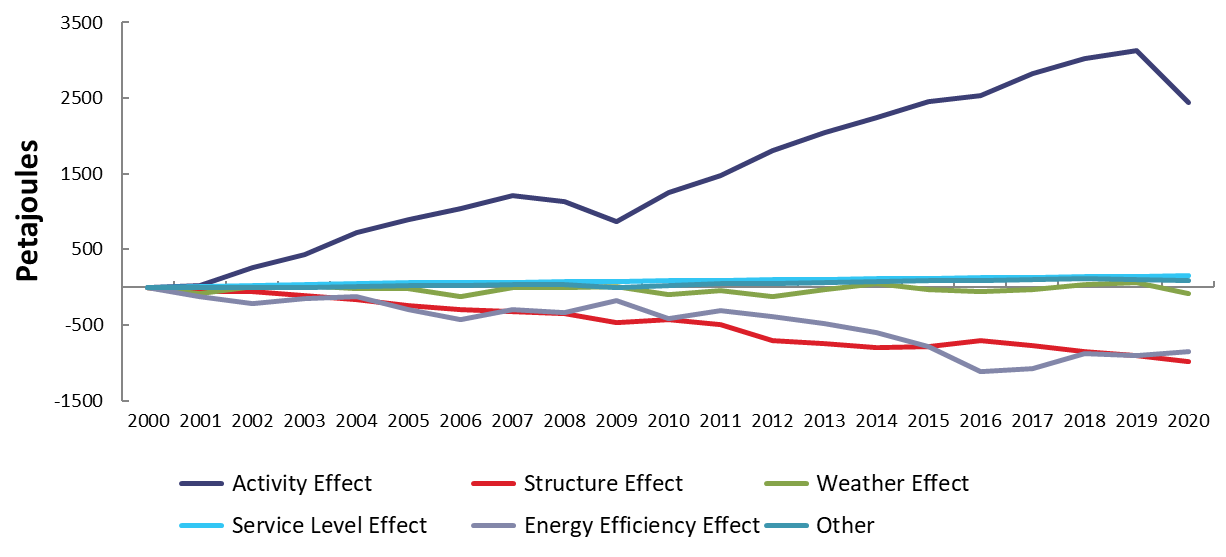
Historical trends of factors influencing final energy use, 2000–2020 (petajoules)
Text version
Historical trends of factors influencing final energy use, 2000–2020 (petajoules)
| Activity effect | Structure effect | Weather effect | Service level effect | Energy efficiency effect | Other | |
|---|---|---|---|---|---|---|
| 2000 | 0 | 0 | 0 | 0 | 0 | 0 |
| 2001 | 18 | -56 | -84 | 12 | -119 | 0 |
| 2002 | 262 | -52 | 9 | 23 | -216 | -7 |
| 2003 | 430 | -109 | 25 | 33 | -155 | -1 |
| 2004 | 720 | -167 | -16 | 44 | -124 | 8 |
| 2005 | 892 | -241 | -16 | 55 | -299 | 19 |
| 2006 | 1,042 | -296 | -123 | 63 | -423 | 20 |
| 2007 | 1,205 | -326 | -10 | 67 | -298 | 39 |
| 2008 | 1,129 | -355 | 0 | 73 | -342 | 40 |
| 2009 | 863 | -465 | 10 | 78 | -172 | -5 |
| 2010 | 1,248 | -428 | -95 | 83 | -410 | 27 |
| 2011 | 1,476 | -490 | -49 | 89 | -314 | 51 |
| 2012 | 1,806 | -704 | -127 | 97 | -390 | 45 |
| 2013 | 2,041 | -742 | -26 | 105 | -486 | 62 |
| 2014 | 2,242 | -805 | 46 | 113 | -594 | 70 |
| 2015 | 2,450 | -784 | -34 | 120 | -786 | 82 |
| 2016 | 2,531 | -704 | -62 | 127 | -1,113 | 90 |
| 2017 | 2,819 | -766 | -33 | 133 | -1,073 | 97 |
| 2018 | 3,024 | -845 | 40 | 140 | -879 | 113 |
| 2019 | 3,134 | -909 | 60 | 147 | -903 | 106 |
| 2020 | 2,437 | -987 | -79 | 157 | -847 | 94 |
Of all these effects, a steady growth in activity contributed the most to increased energy use. However, in 2020, the activity effect shows a sharp drop in total energy use due to the COVID-19 pandemic. The structure effect resulting from a shift in production toward industries that are less energy-intensive (i.e., pulp and paper) also drove energy use downward, especially from 2005.
Energy efficiency improvement has been steady since 2000. However, the rate of improvement slowed down during the 2008-2010 recession, which can be attributed to slower economic growth. For example, fewer goods were delivered by freight transportation despite travelling the same distance as before the recession. More recently, the industrial sector from 2018, and the commercial sector from 2016, show a slowdown in energy efficiency improvement.
The slowdown in energy efficiency in the industrial sector may be caused by the underutilized capacity at industrial plants since 2018. Especially in 2020, manufacturing facilities operated at only 72.6% capacity due to the impact of COVID-19; the lowest since the 2008-2010 recession.
For the commercial/institutional sector, the slowdown is attributable to a faster increase of energy use than the growth in activity, measured by floor space. Specifically, natural gas use started to increase significantly from 2016 onward, breaking the stable level of natural gas use of around 500 PJ a year during the 2000-2015 period. Over this period, the activity level (floor space) increased at a much slower pace of 2%. This misalignment has been driving the slowdown in energy efficiency improvement since 2016 in the sector.
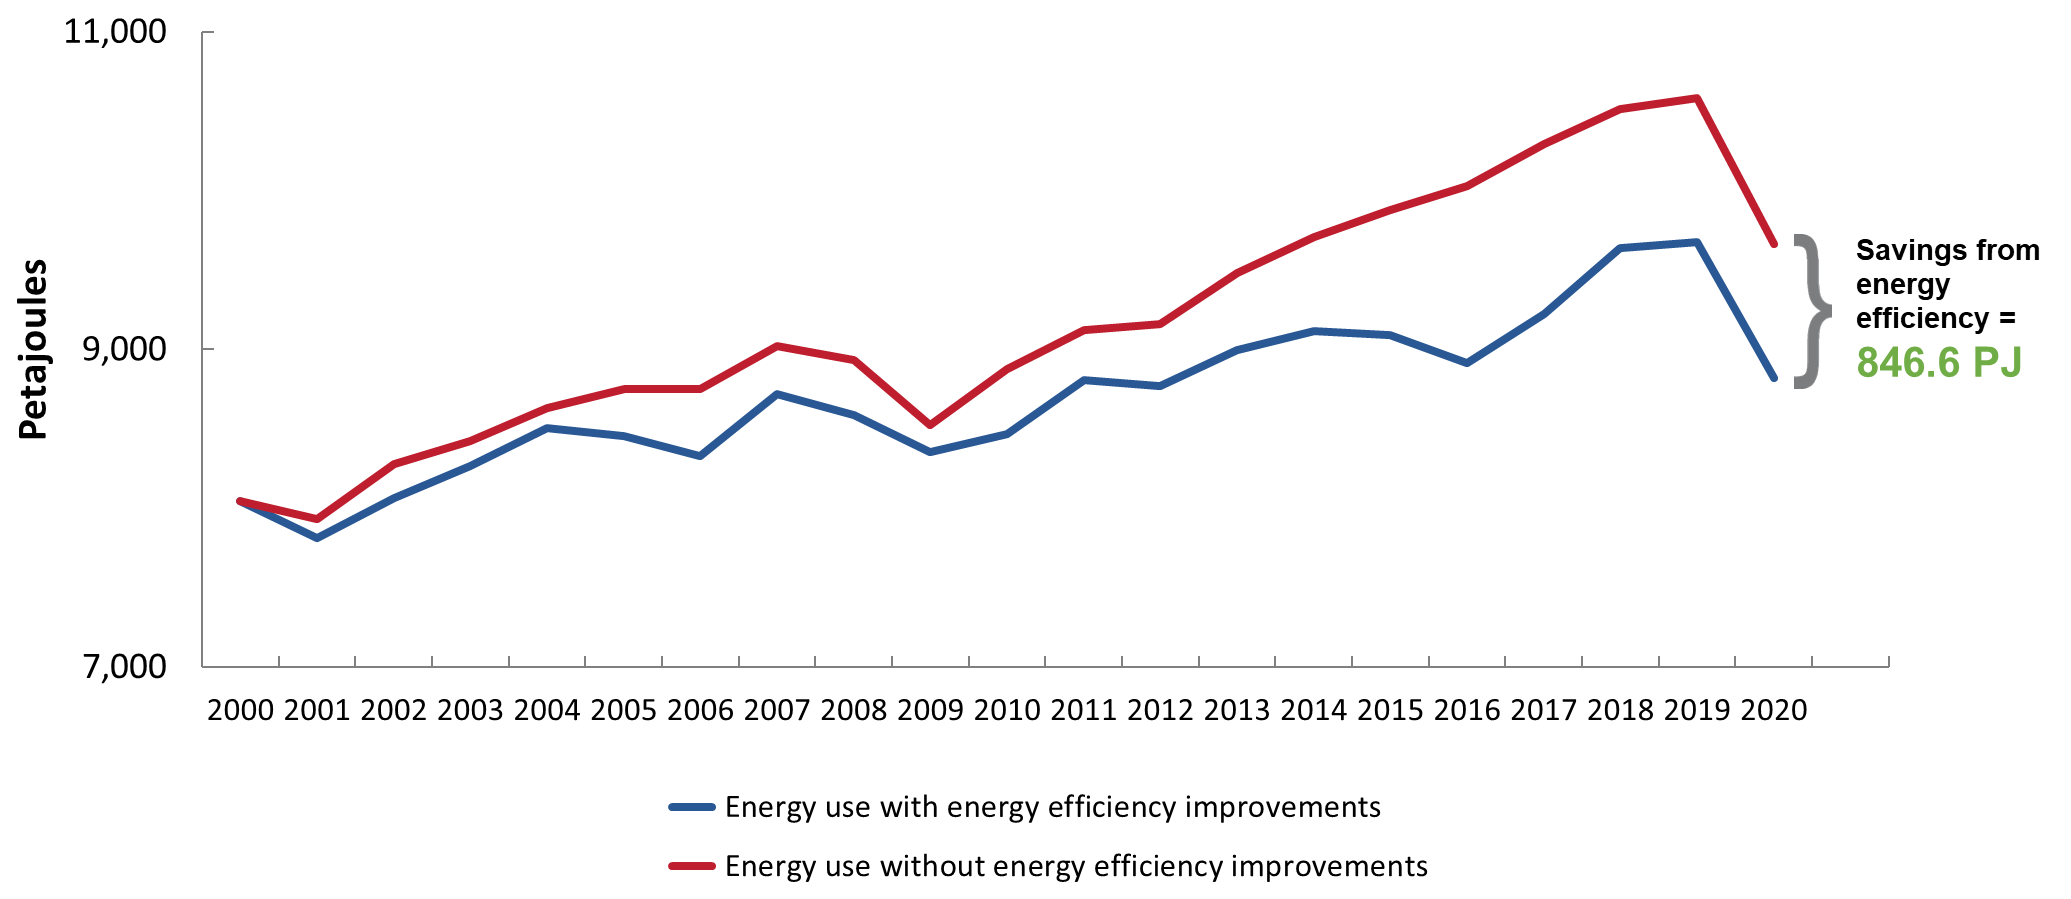
Final energy use, with and without energy efficiency improvements, 2000–2020 (petajoules)
Text version
Final energy use, with and without energy efficiency improvements, 2000–2020 (petajoules)
| Energy use with energy efficiency improvements | Energy use without energy efficiency improvements | |
|---|---|---|
| 2000 | 8,042 | 8,042 |
| 2001 | 7,812 | 7,931 |
| 2002 | 8,061 | 8,277 |
| 2003 | 8,264 | 8,419 |
| 2004 | 8,505 | 8,629 |
| 2005 | 8,453 | 8,752 |
| 2006 | 8,326 | 8,749 |
| 2007 | 8,719 | 9,017 |
| 2008 | 8,587 | 8,929 |
| 2009 | 8,352 | 8,524 |
| 2010 | 8,466 | 8,876 |
| 2011 | 8,805 | 9,119 |
| 2012 | 8,770 | 9,160 |
| 2013 | 8,996 | 9,482 |
| 2014 | 9,114 | 9,708 |
| 2015 | 9,090 | 9,876 |
| 2016 | 8,912 | 10,024 |
| 2017 | 9,219 | 10,292 |
| 2018 | 9,635 | 10,514 |
| 2019 | 9,677 | 10,580 |
| 2020 | 8,818 | 9,664 |
Without significant and ongoing energy efficiency improvements in end-use sectors, energy use would have increased 20.2% between 2000 and 2020 instead of 10.5%.
 GHG emissions
Text version
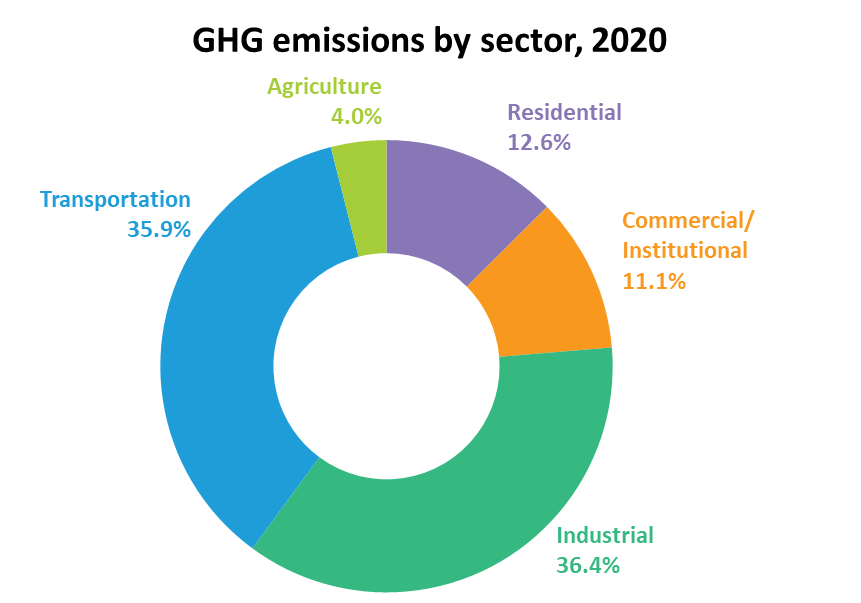
GHG emissions by sector, 2020
| Distribution of GHGs | Percentage |
|---|---|
| Residential | 12.6 |
| Commercial/institutional | 11.1 |
| Industrial | 36.4 |
| Transportation | 35.9 |
| Agriculture | 4.0 |
Until 2019, the transportation sector had been the largest emitter of GHG followed by the industrial sector, because of its greater use of more emission-intensive fuels such as gasoline, diesel, and heavy fuel oil. However, the trend was broken in 2020 as transportation energy use decreased significantly due to COVID-19. The industrial sector had the largest share of emissions accounting for 36.4%, followed by the transportation sector which accounted for 35.9%, which is slightly lower than its average of 38.0% during 2010-2019 period.
Text version
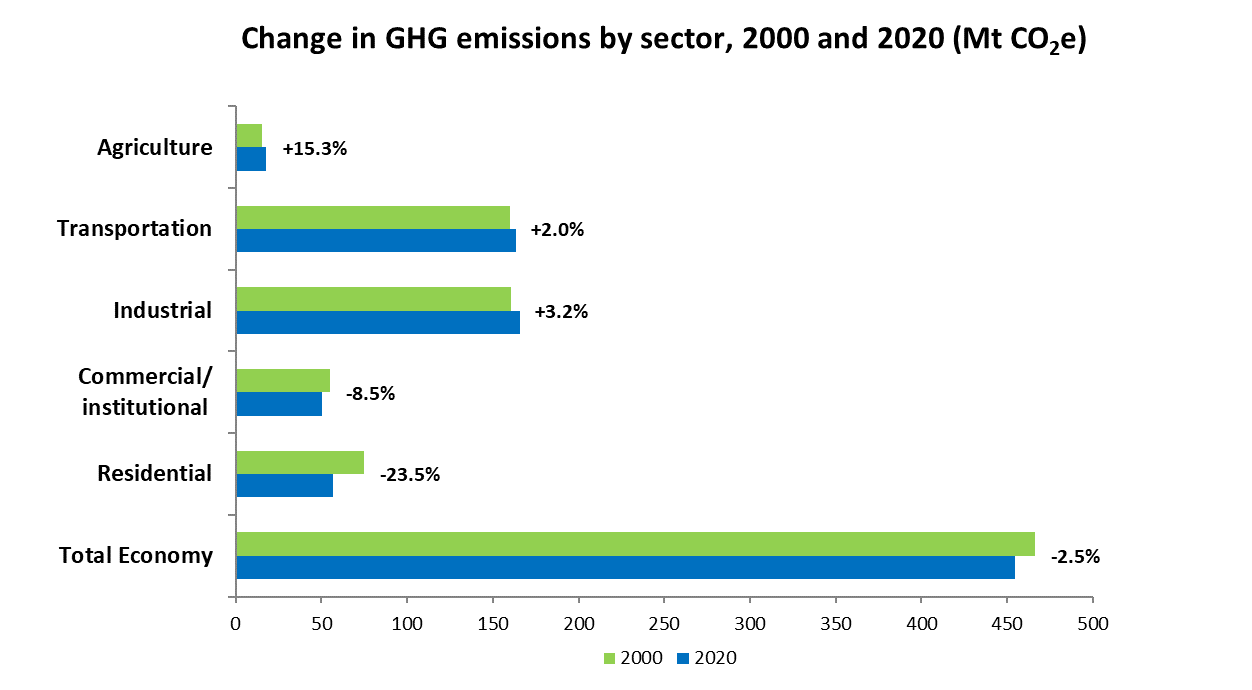
Change in GHG emissions by sector, 2000 and 2020 (Mt CO2e)
| 2000 | 2020 | Growth/decrease (%) | |
|---|---|---|---|
| Agriculture | 15.6 | 18.0 | 15.3 |
| Transportation | 160.1 | 163.3 | 2.0 |
| Industrial | 160.5 | 165.6 | 3.2 |
| Commercial/institutional | 55.2 | 50.5 | -8.5 |
| Residential | 74.6 | 57.1 | -23.5 |
| Total Economy | 466.0 | 454.5 | -2.5 |
Text version
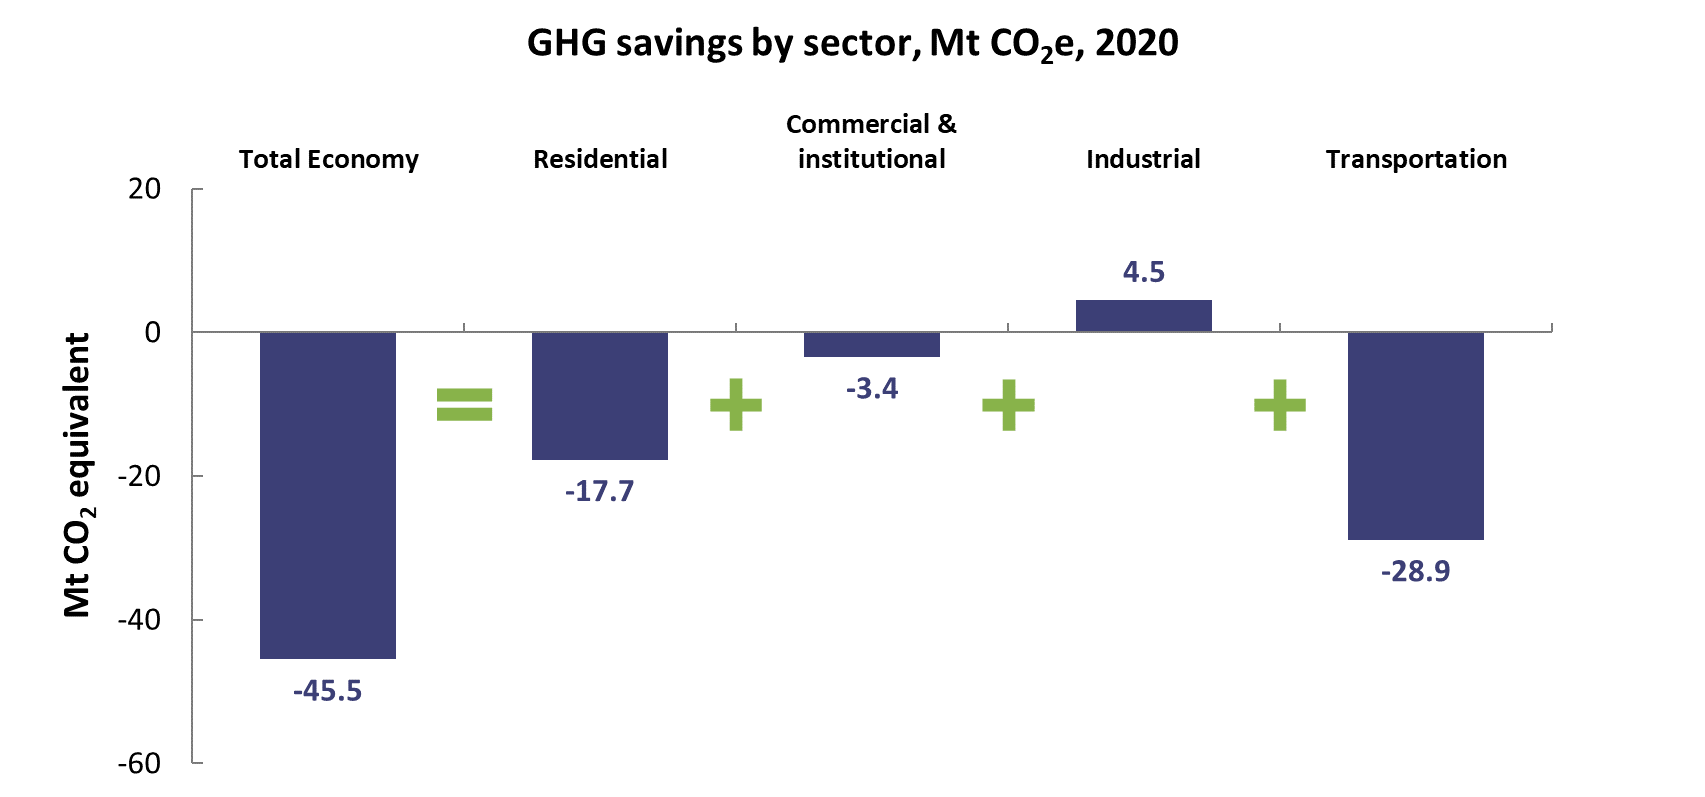
GHG savings by sector, 2020 (Mt CO2e)
| Mt CO2e | |
|---|---|
| Total economy | -45.5 |
| Residential | -17.7 |
| Commercial/institutional | -3.4 |
| Industrial | 4.5 |
| Transportation | -28.9 |
The transportation sector was the largest contributor at 63.5% of total GHG savings, largely driven by the ongoing introduction of performance standards for passenger vehicles and light-duty trucks. In 2020, due to the sudden drop in transportation activities, total energy use fell by 17.3% from the previous year, resulting in lower GHG emissions. Other contributing factors were awareness and education programs that increased fuel efficiency through maintenance, and improved driving habits.
The residential sector contributed 38.9% to the total GHG savings through several policy measures, including enhanced building codes, minimum energy performance standards for appliances, improved energy monitoring systems, and home retrofits.
The commercial/institutional sector contributed 7.5% of total GHG savings, while the industrial sector offset GHG emissions by 10% due to energy intensive processes in 2020.