Energy Use in the Commercial/Institutional Sector
![]()
The Office of Energy Efficiency at Natural Resources Canada has changed the base year from 1990 to 2000. This change was made to ensure that our data reflects developments in trends and structures of Canada’s energy end use and efficiency across sectors. It also synchronizes reporting on Canada’s energy use data with changes made by the International Energy Agency.
Highlights
- Energy efficiency in the commercial/institutional sector improved 8%, saving Canadians 82.4 PJ in energy and $2.2 billion in costs.
- Commercial/Institutional energy use increased 23% Footnote 1 , but it would have increased 31% without energy efficiency improvements.
- Energy efficiency helped avoid 3.4 Mt in GHG emissions.
 Overview – Energy use and GHG emissions
Text version
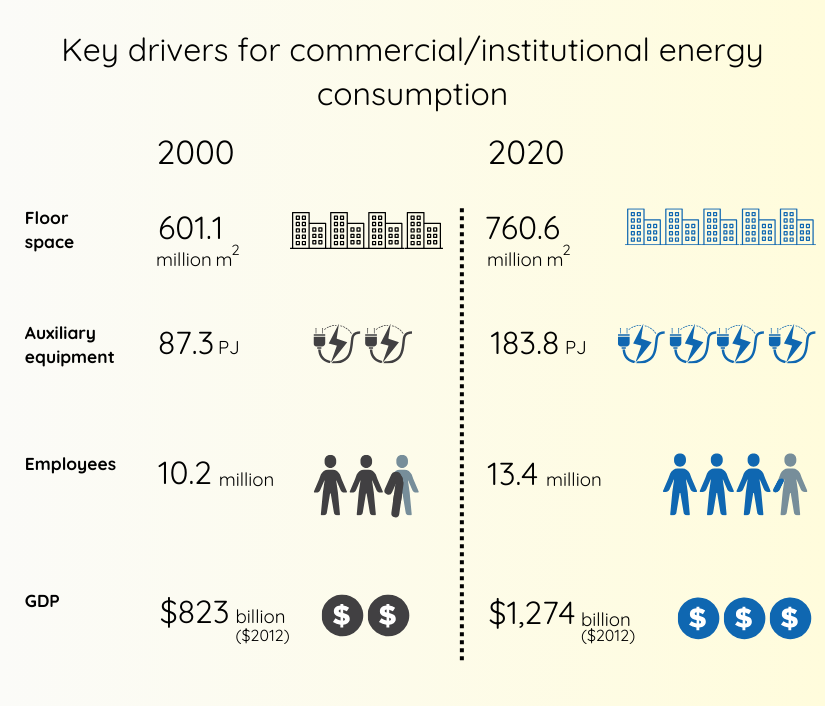
Key drivers for commercial/institutional energy consumption
| 2000 | 2020 | |
|---|---|---|
| Floor space (million m2) | 601.1 | 760.6 |
| Auxiliary Equipment (PJ) increased | 87.3 | 183.8 |
| Employees (thousands) increased | 10,207 | 13,364 |
| GDP (million $2012 constant dollars) increased | 823,297 | 1,273,834 |
Major activities in the commercial/institutional buildings include trade, finance, real estate, public administration, education, and commercial services. These activities are grouped into 10 subsectors.
In 2020, commercial businesses and institutions spent $31.8 billion on energy to provide services to Canadians. Offices, retail trade and educational services accounted for about 70% of total Canadian commercial/institutional floor space in 2020.
Text version
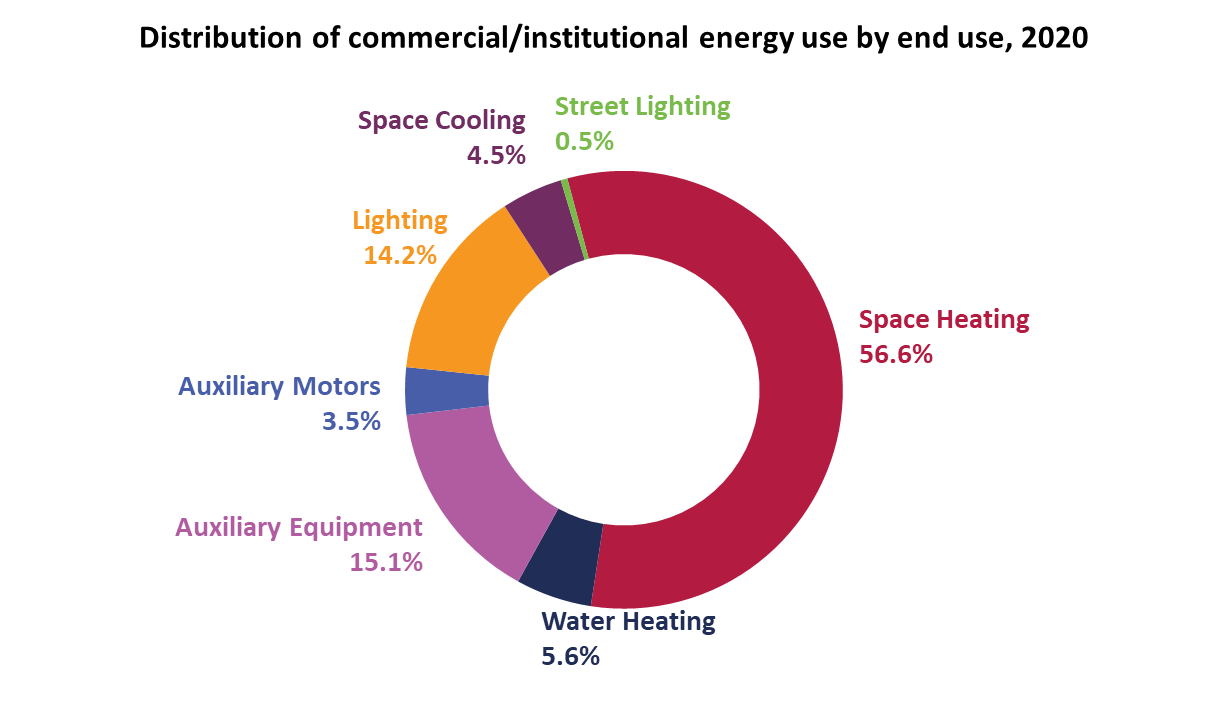
Distribution of commercial/institutional energy use by end use, 2020
| Commercial/institutional energy use | Percentage |
|---|---|
| Space heating | 56.6 |
| Auxiliary equipment | 15.1 |
| Lighting | 14.2 |
| Water heating | 5.6 |
| Auxiliary motors | 3.5 |
| Space cooling | 4.5 |
| Street lighting | 0.5 |
Energy is used for various purposes, such as space heating, cooling, lighting, water heating, and for operating auxiliary equipment (e.g. computers and medical equipment) and auxiliary motors (e.g. backup power systems). Space heating accounted for the largest share of energy use (57%), followed by auxiliary equipment (15%), and then lighting (14%).
 Energy efficiency
Without energy efficiency gains, energy use would have increased 31% instead of 23%.
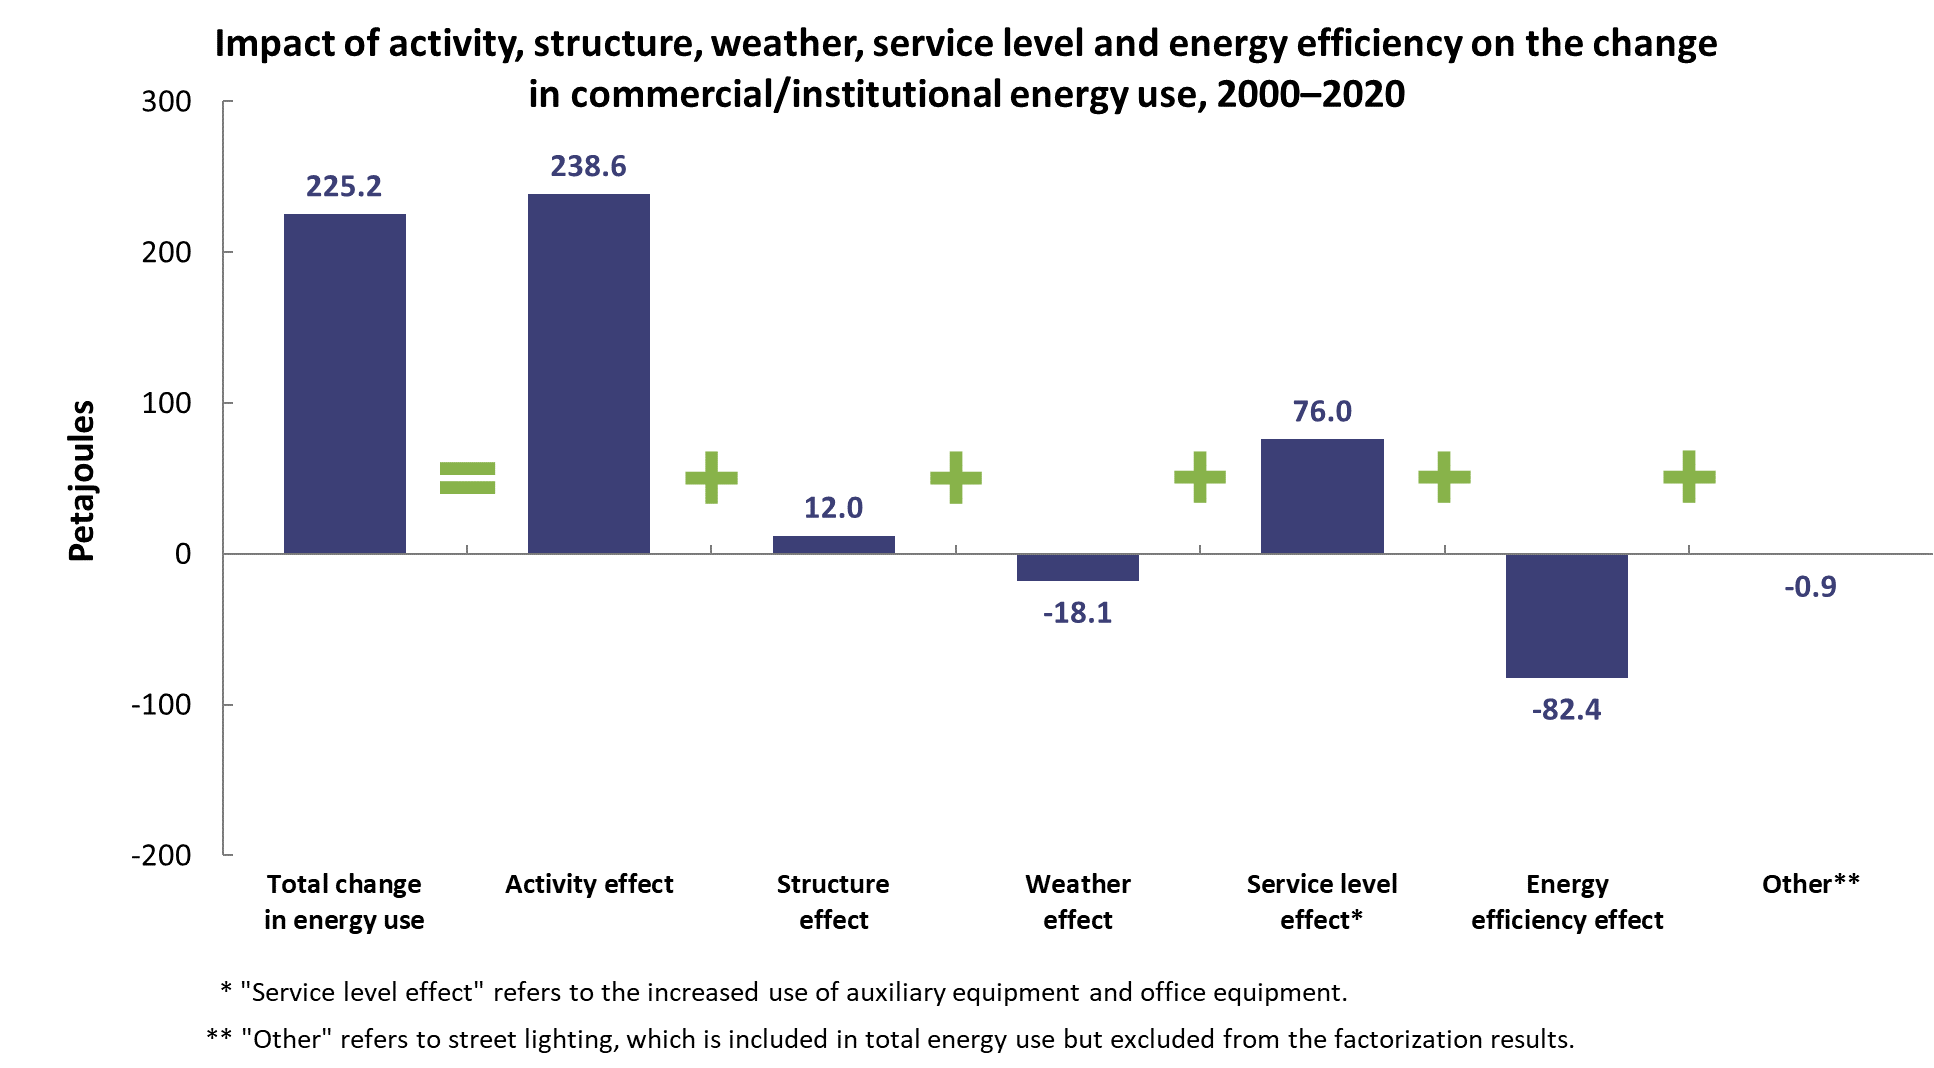
Energy efficiency is measured by using the factorization method. This method separates total change into five effects (factors) that influence the sector’s energy consumption, as illustrated below. Energy efficiency improvement corresponds to the difference between the total change in commercial/institutional energy use and the impacts of activity, structure, weather, and service level effects.
Text version
Impact of activity, structure, service level, weather and energy efficiency on the change in commercial/institutional energy use, 2000–2020
| Petajoules | |
|---|---|
| Total change in energy use | 225.2 |
| Activity effect | 238.6 |
| Structure effect | 12.0 |
| Weather effect | -18.1 |
| Service level effect Footnote * | 76.0 |
| Energy efficiency effect | -82.4 |
| Other Footnote * | -0.9 |
- Activity effect – A 27% increase in floor space resulted in an increase of 238.6 PJ in energy and 9.9 Mt in GHG emissions.
- Structure effect – reflects the changes in the floor space proportion of respective activity types. A slight increase in the proportion of floor space in buildings with more intensive activities, such as health services, accommodation services and, to a lesser extent, office and educational buildings, was observed in 2020. Conversely, the floor space proportion decreased for warehouses and wholesale trade activities, which are less energy intensive. These changes resulted in an increase of 12.0 PJ in energy and 0.5 Mt in GHG emissions.
- Weather effect – In 2020, the winter was milder than in 2000 and the summer was hotter than in 2000. The net result was a decrease of 18.1 PJ in energy and 0.8 Mt of GHG emissions.
- Service level effect – An increase of auxiliary equipment (e.g. computers, fax machines and photocopiers) resulted in an increase of 76.0 PJ in energy and 3.2 Mt in GHG emissions.
- Energy efficiency effect – The 8% improvement in energy efficiency saved 82.4 PJ in energy, and $2.2 billion in costs and avoided 3.4 Mt of GHG emissions.
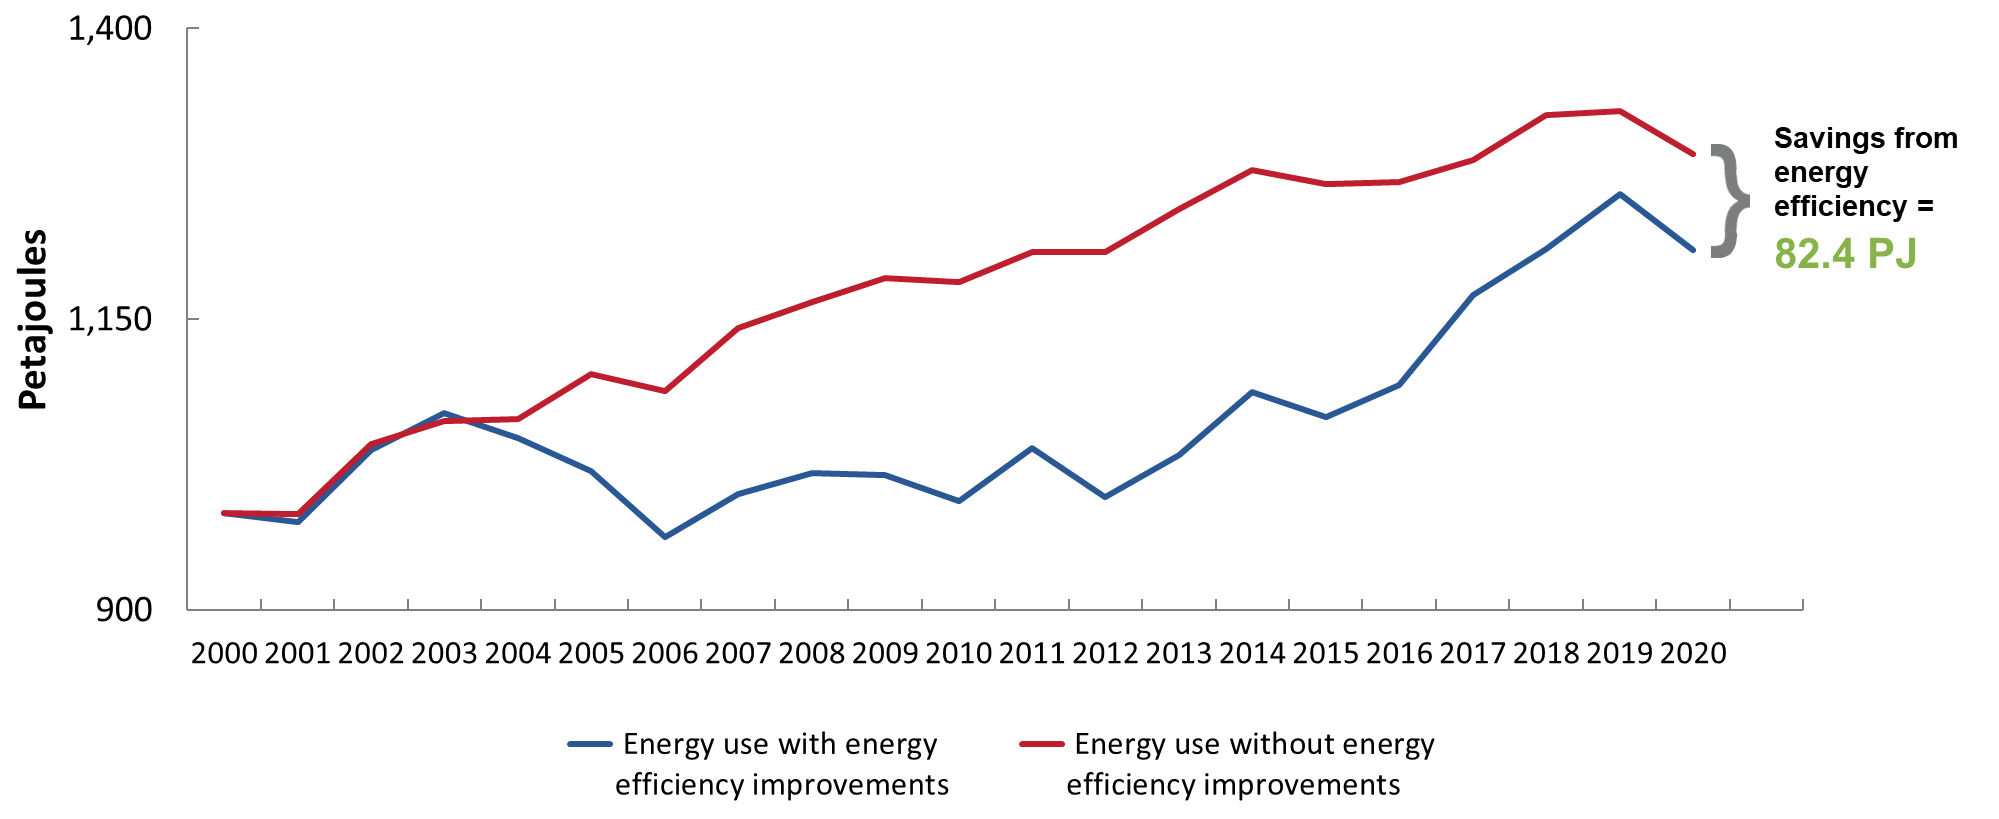
Commercial/institutional energy use, with and without energy efficiency improvements, from 2000–2020 (petajoules)
Text version
Commercial/institutional energy use, with and without energy efficiency improvements, from 2000–2020 (petajoules)
| Energy use with energy efficiency improvements | Energy use without energy efficiency improvements | |
|---|---|---|
| 2000 | 983 | 983 |
| 2001 | 976 | 983 |
| 2002 | 1,037 | 1,043 |
| 2003 | 1,069 | 1,062 |
| 2004 | 1,048 | 1,064 |
| 2005 | 1,019 | 1,103 |
| 2006 | 963 | 1,088 |
| 2007 | 999 | 1,143 |
| 2008 | 1,018 | 1,164 |
| 2009 | 1,016 | 1,185 |
| 2010 | 994 | 1,182 |
| 2011 | 1,039 | 1,207 |
| 2012 | 998 | 1,208 |
| 2013 | 1,033 | 1,245 |
| 2014 | 1,087 | 1,278 |
| 2015 | 1,066 | 1,266 |
| 2016 | 1,093 | 1,268 |
| 2017 | 1,171 | 1,287 |
| 2018 | 1,210 | 1,326 |
| 2019 | 1,257 | 1,329 |
| 2020 | 1,210 | 1,292 |
The overall energy efficiency trends show a slight slowdown in energy savings starting in 2017. This is attributable to a faster growth in energy use, compared to the activity (floor space). The main increase was in natural gas energy use which grew 7% in 16 years (2000 to 2016), while it grew 19% beween 2016 and 2020. This does not align with the growth of floor space, which was less than 2% over the same four-year period. Ontario and Alberta combined accounted for 94% (or 94 PJ) of the natural gas growth, and 86% of the total energy use increase since 2016. (Statistics Canada is investigating these numbers.)
 Energy use
From 2000 to 2020, the sector’s contribution to GDP grew nearly 55%, and floor space grew 27%. At the same time, its energy use increased 23% from 990.3 to 1,215.5 PJ (including street lighting). The associated GHG emissions, including electricity-related emissions, decreased about 8%.
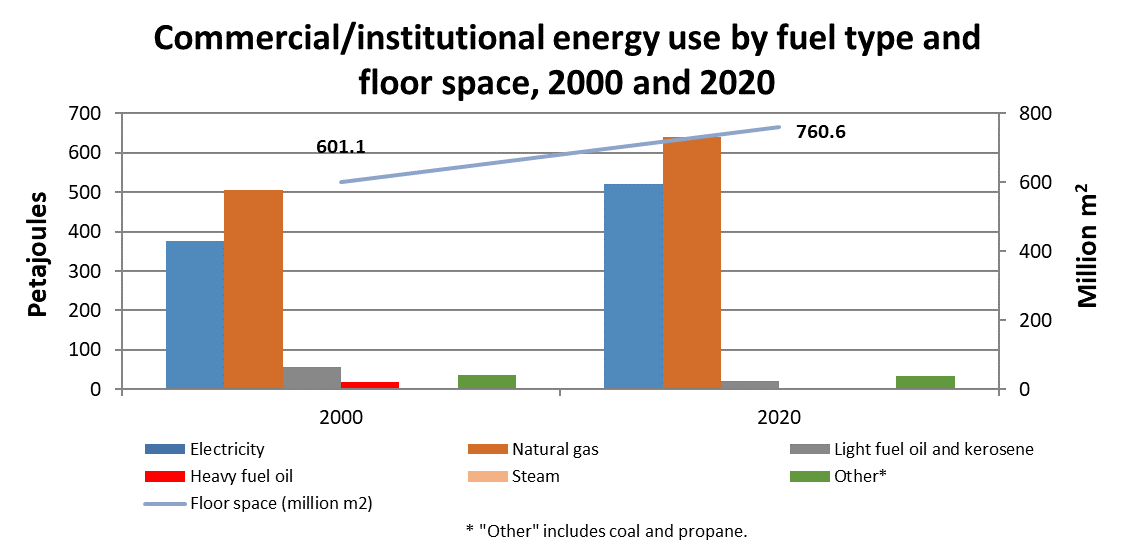
In 2020, natural gas and electricity were the main energy sources used in this sector, accounting respectively for 53% and 43% of total energy use. Electricity was the primary energy source for lighting, space cooling, and auxiliary motors and equipment. Natural gas was the primary energy source for space and water heating. Natural gas and propane were also used in small proportions to provide energy for auxiliary equipment, such as the propane that is used for stoves and the natural gas that is used for space cooling services.
Text version
Commercial/institutional energy use by fuel type and floor space, 2000 and 2020 (petajoules)
| 2000 | 2020 | |
|---|---|---|
| Electricity | 376.43 | 520.65 |
| Natural gas | 504.09 | 639.71 |
| Light fuel oil and kerosene | 55.66 | 20.30 |
| Heavy fuel oil | 17.95 | 0.25 |
| Steam | 0.31 | 0.43 |
| Other Footnote * | 35.86 | 34.20 |
| Floor space (millions m2) | 601.1 | 760.6 |
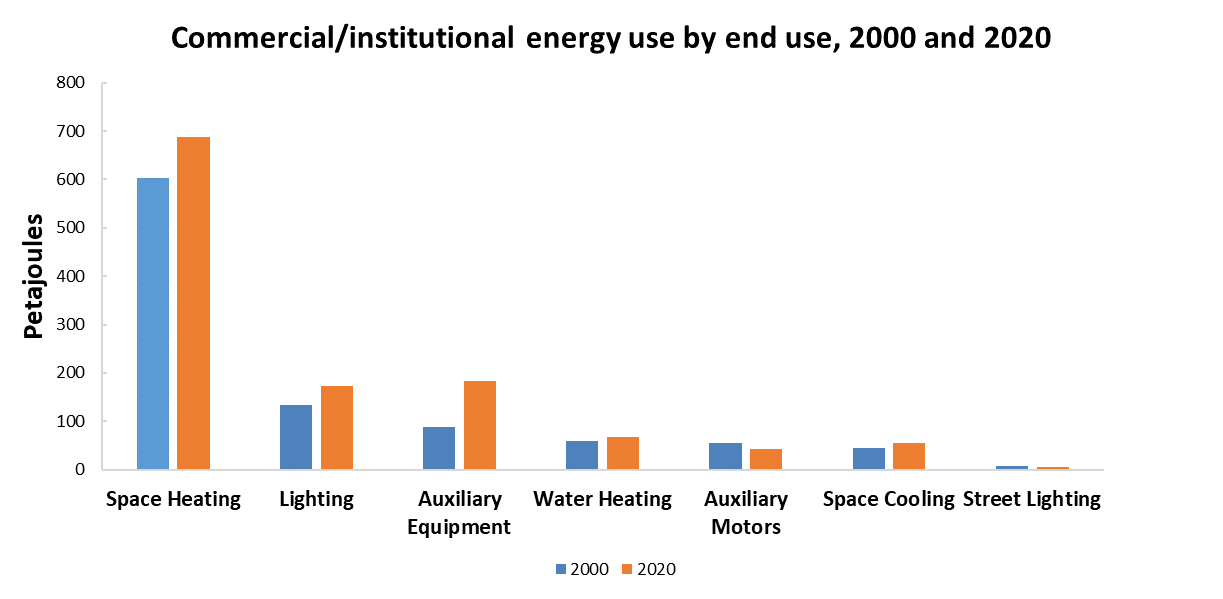
Space heating continued to be the primary end use in the sector. However, auxiliary equipment experienced the largest increase in energy use (110%) and was responsible for 43% of the sector’s aggregate change in energy use, driven by the increasing computerization in the sector’s activities, including medical equipment. Lighting energy consumption increased 28% and was responsible for 17% of the total change. Space heating energy consumption increased 14% but was responsible for 38% of the total change.
Text version
Commercial/institutional energy use by end use, 2000 and 2020 (petajoules)
| 2000 | 2020 | |
|---|---|---|
| Space Heating | 603.1 | 687.8 |
| Lighting | 134.4 | 172.4 |
| Auxiliary Equipment | 87.3 | 183.8 |
| Water Heating | 58.5 | 68.2 |
| Auxiliary Motors | 54.6 | 42.6 |
| Space Cooling | 45.5 | 54.8 |
| Street Lighting | 6.9 | 6.0 |
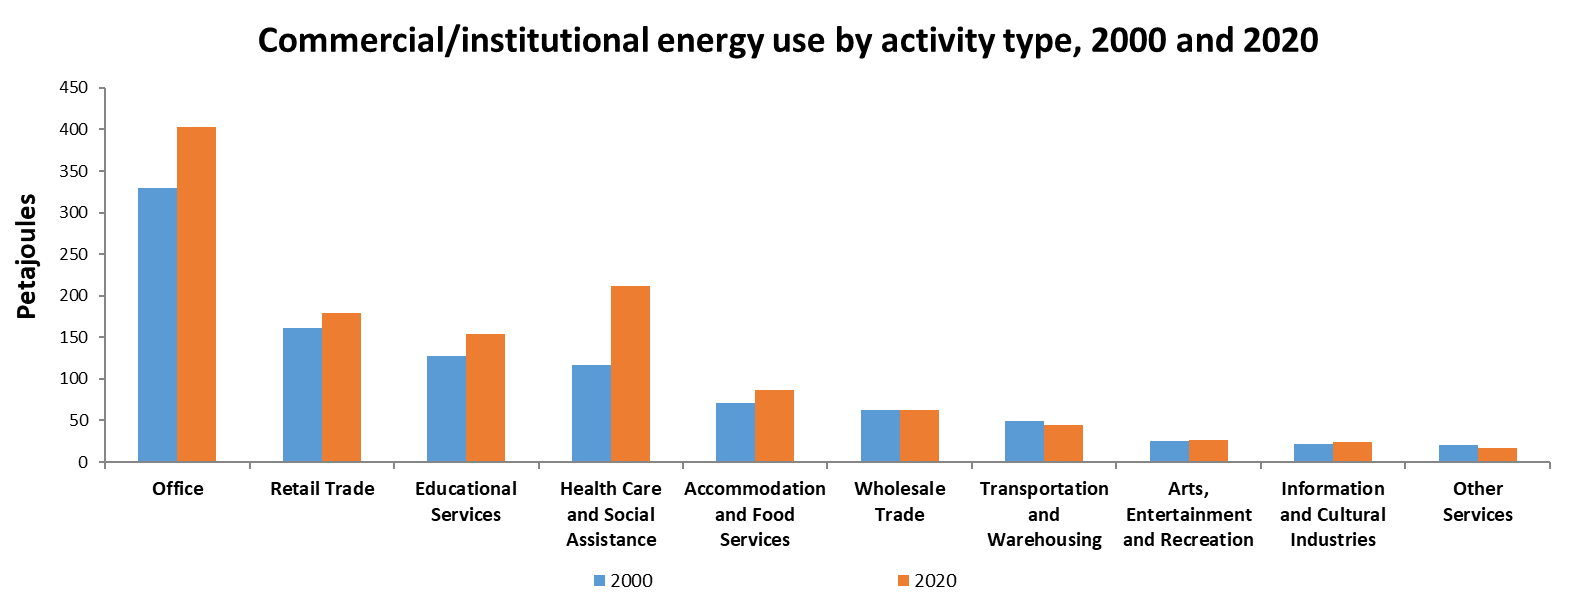
In 2020, offices accounted for the highest share of energy use (33%). This subsector includes public administration, activities related to finance and insurance; real estate, rental and leasing; professional, scientific, and technical services; and other offices. Health care and social assistance services accounted for 18%; retail trade for 15%; and educational services for 13% – these were the next largest users. Combined, these activities accounted for more than three quarter of the sector’s total energy use.
Text version
Commercial/institutional energy use by activity type, 2000 and 2020 (petajoules)
| 2000 | 2020 | |
|---|---|---|
| Office | 329.6 | 403.0 |
| Retail Trade | 160.8 | 179.1 |
| "EducationalServices" | 127.1 | 154.2 |
| "Health Careand SocialAssistance" | 117.3 | 212.1 |
| "Accommodationand FoodServices" | 70.7 | 86.5 |
| "WholesaleTrade" | 62.5 | 62.1 |
| "TransportationandWarehousing" | 49.1 | 44.6 |
| "Arts,Entertainmentand Recreation" | 25.1 | 26.7 |
| "Informationand CulturalIndustries" | 21.2 | 23.9 |
| "OtherServices" | 20.0 | 17.5 |
Several factors contribute to the growth in energy use in the commercial/institutional sector, including an increase in floor space, GDP, and the number of employees.
Energy efficiency gains were achieved in terms of overall energy use per floor space. This was offset by an increase in energy requirements for auxiliary equipment. There was an overall increase in computerization of the work environment during this period, as well as an increase in the number of devices required per employee.
 Energy intensity
Text version
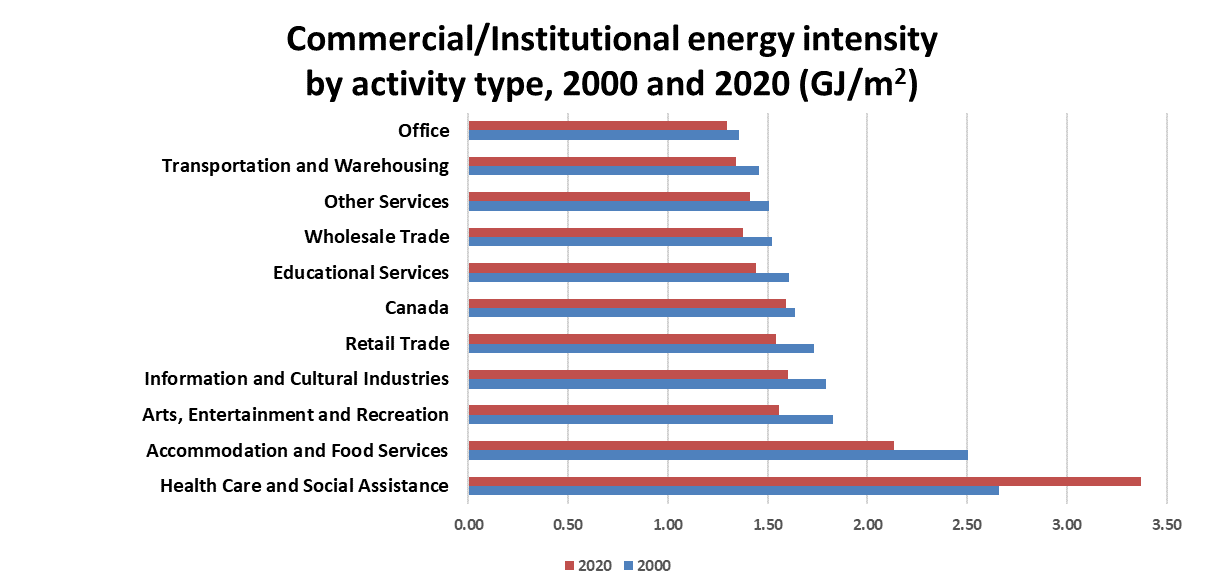
Energy intensity by activity type, 2000 and 2020 (GJ/m2)
| 2000 | 2020 | |
|---|---|---|
| Office | 1.36 | 1.29 |
| Transportation and Warehousing | 1.46 | 1.34 |
| Other Services | 1.51 | 1.41 |
| Wholesale Trade | 1.52 | 1.38 |
| Educational Services | 1.61 | 1.44 |
| Canada | 1.64 | 1.59 |
| Retail Trade | 1.73 | 1.54 |
| Information and Cultural Industries | 1.79 | 1.60 |
| Arts, Entertainment and Recreation | 1.83 | 1.55 |
| Accommodation and Food Services | 2.50 | 2.14 |
| Health Care and Social Assistance | 2.66 | 3.37 |
Text version
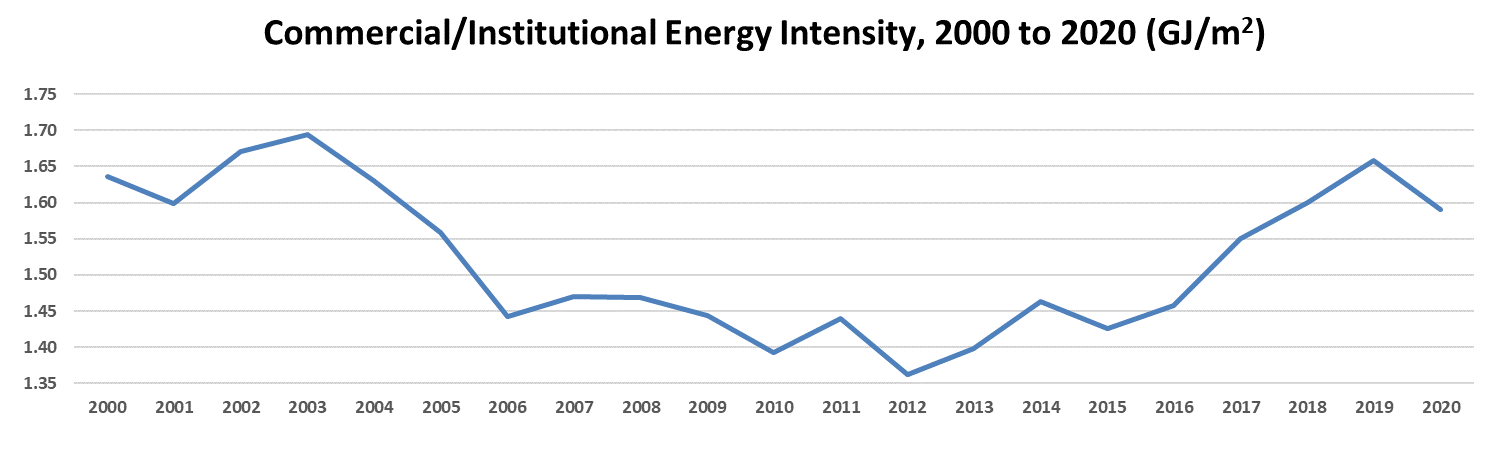
Commercial Institutional Energy Intensity, 2000–2020 (GJ/m2)
| Year | Energy Intensity (GJ/m2) |
|---|---|
| 2000 | 1.64 |
| 2001 | 1.60 |
| 2002 | 1.67 |
| 2003 | 1.69 |
| 2004 | 1.63 |
| 2005 | 1.56 |
| 2006 | 1.44 |
| 2007 | 1.47 |
| 2008 | 1.47 |
| 2009 | 1.44 |
| 2010 | 1.39 |
| 2011 | 1.44 |
| 2012 | 1.36 |
| 2013 | 1.40 |
| 2014 | 1.46 |
| 2015 | 1.43 |
| 2016 | 1.46 |
| 2017 | 1.55 |
| 2018 | 1.60 |
| 2019 | 1.66 |
| 2020 | 1.59 |
There was a 3% decrease in the energy intensity for the sector in terms of energy consumed per unit of floor space (GJ/m2). In 2020, the most energy-intensive activity types were health care and social assistance with 3.4 GJ/m2. This can be attributed in part to the energy-demanding nature of this subsector’s activities, including extensive hours of operation, as well as the use of new technologies, which require more electronic equipment. Moreover, in 2020, energy consumption in this subsector increased significantly due to the sanitary requirements brought on by COVID-19.
Moreover, energy use intensity decreased 21% when measured against economic activity (PJ/$GDP).