Primary Metal Manufacturing
Text version
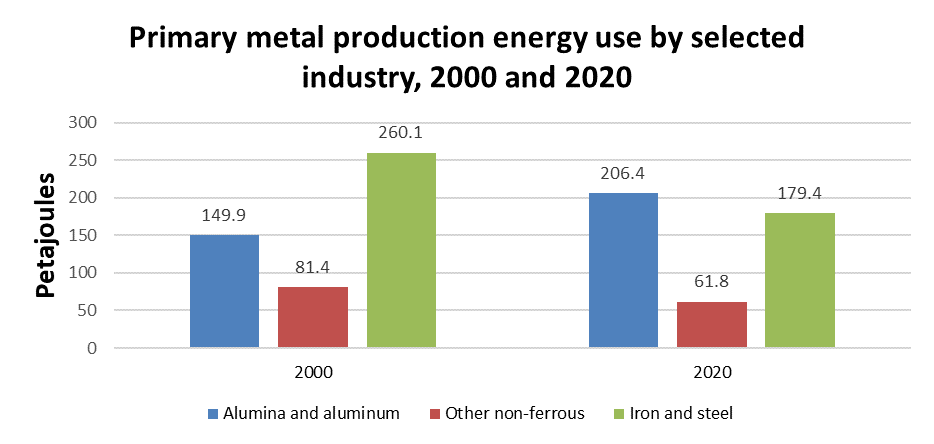
Primary metal production energy use by selected industry, 2000 and 2020 (petajoules)
| 2000 | 2020 | |
|---|---|---|
| Alumina and aluminum | 149.9 | 206.4 |
| Other non-ferrous | 81.4 | 61.8 |
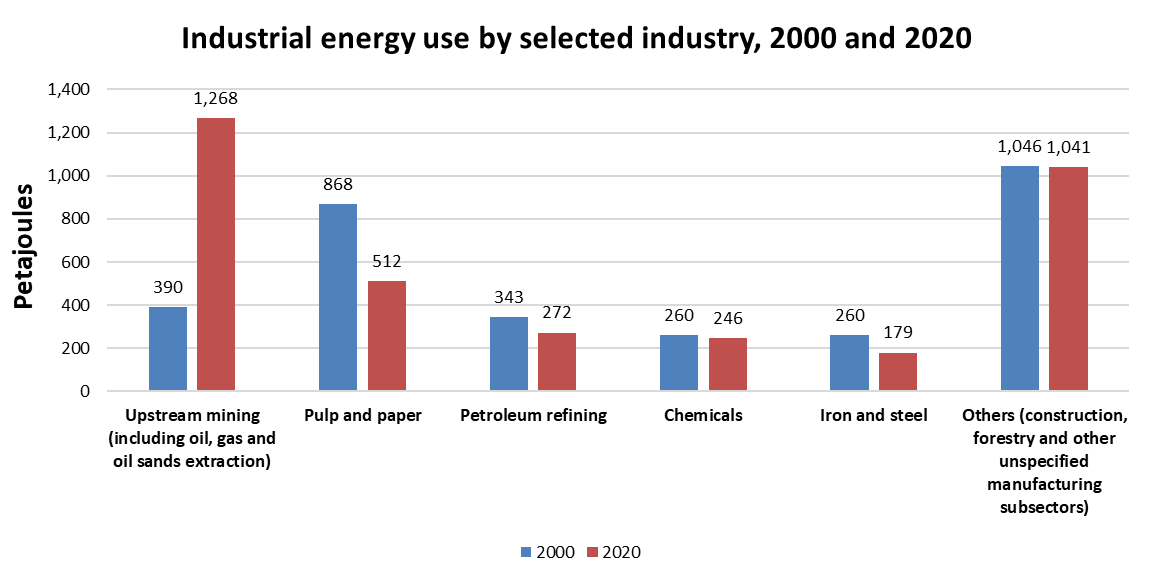
| Iron and steel | 260.1 | 179.4 |
Energy use for primary metal production decreased 8.9% from 2000 to 2020, mostly due to declining energy demand in iron and steel production, even though energy consumption in alumina and aluminum production rose significantly.
Energy demand in the manufacturing of alumina and aluminum grew 37.7%, driven up by the 31.2% production increase. However, as electricity accounted for nearly 90% of its total energy consumption and electricity is gradually becoming cleaner, energy used in the production of alumina and aluminum emitted 25.0% less GHG emissions. Since 2000, this subsector’s contribution to GDP in the production of alumina and aluminum has increased 50.8%, from $1.9 billion in 2000 to $2.9 billion in 2020 ($2012).