Energy Consumption of Refrigerators

All Appliances
Refrigerators
Freezers
Dishwashers
Ranges
Washers
Dryers
Data tables
Key facts
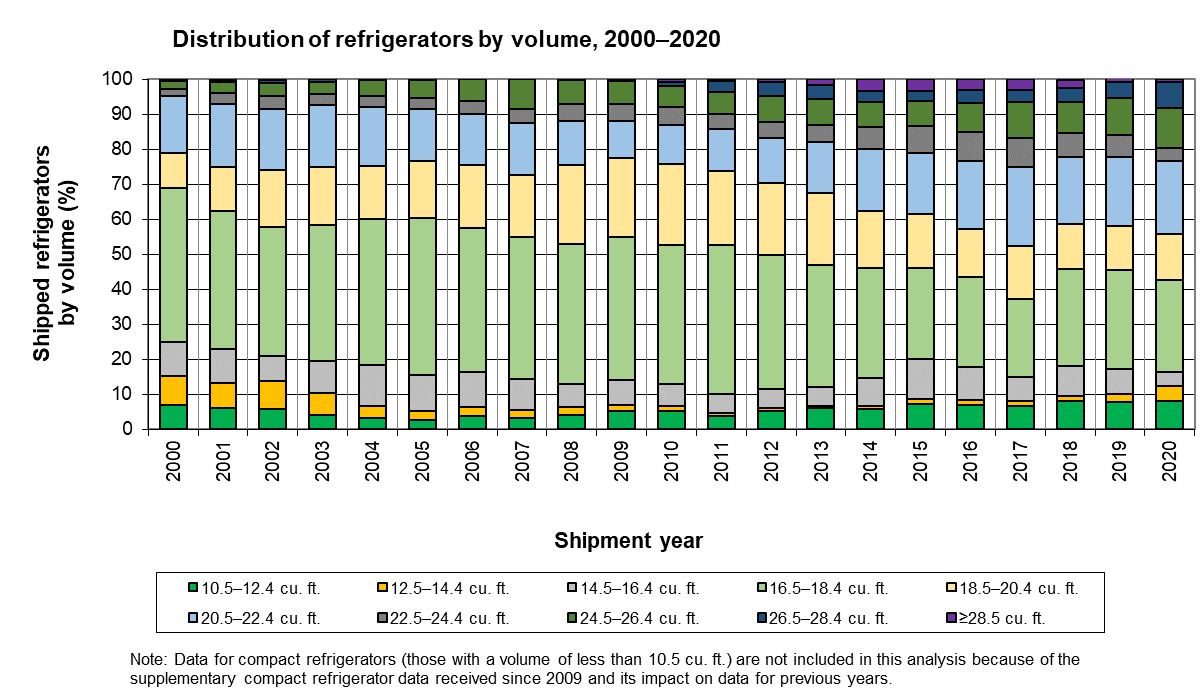
- Increasing consumer preference for larger models – In 2000, only 2.5% of shipped refrigerators were 24.5 cu. ft. or larger, whereas in 2020, 17.2% of them were in that volume category.
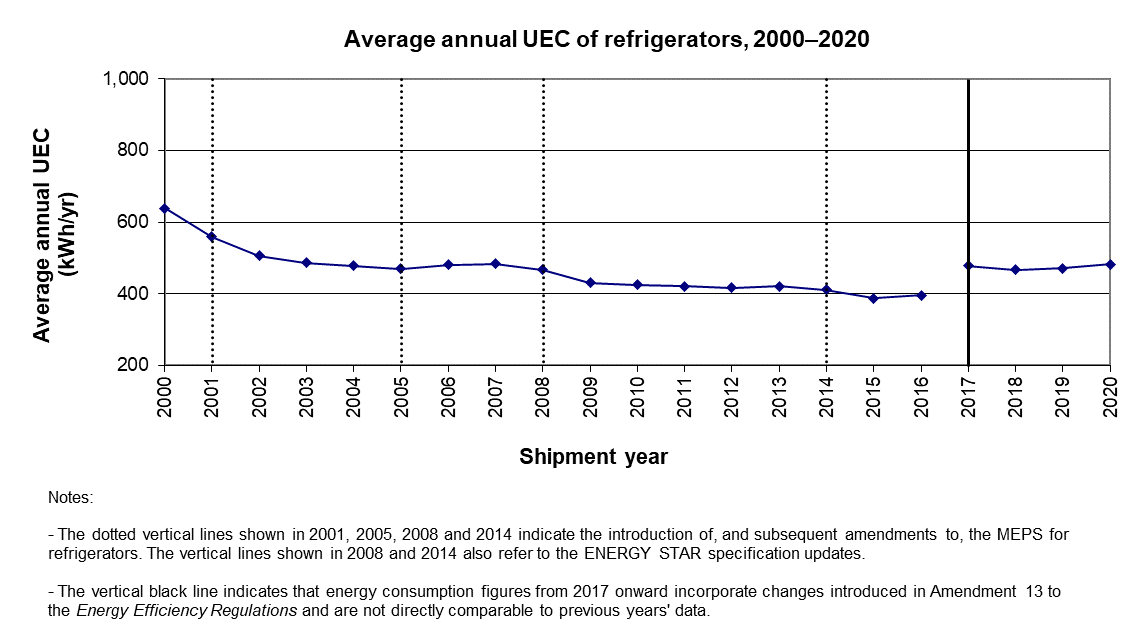
- Continuing reduction in unit energy consumption (UEC) – Although refrigerator volumes increased between 2000 and 2020, the average UEC of refrigerators dropped by 25%. Footnote 1
Average annual unit energy consumption (UEC)
Refrigerators are available in a range of sizes and with a variety of features, all of which affect energy consumption. EnerGuide groups refrigerators by both refrigerator type and size. Footnote 2 These groups allow the comparison of energy consumption among similar models.
Factors contributing to the decrease in average annual UEC include:
- Energy efficiency improvements, coinciding with the introduction of, and subsequent amendments to, the minimum energy performance standards (MEPS) in the Energy Efficiency Regulations.
- ENERGY STAR’s 2008 and 2014 specification updates, as manufacturers implemented further improvements to qualify.
- More stringent MEPS and updated test procedures which came into force in 2017, through amendments to the Energy Efficiency Regulations.
Text version
Average annual Unit Energy Consumption (UEC) of refrigerators, 2000–2020 (kWh/yr)
| Shipment year | UEC (kWh/yr) |
|---|---|
| 2000 | 638.8 |
| 2001 Footnote 1 | 558.9 |
| 2002 | 506.0 |
| 2003 | 487.1 |
| 2004 | 477.7 |
| 2005 Footnote 2 | 469.2 |
| 2006 | 481.0 |
| 2007 | 483.1 |
| 2008 Footnote 2 Footnote 3 | 467.3 |
| 2009 | 430.1 |
| 2010 | 424.9 |
| 2011 | 421.4 |
| 2012 | 416.4 |
| 2013 | 421.3 |
| 2014 Footnote 2 Footnote 3 | 411.1 |
| 2015 | 387.9 |
| 2016 | 395.7 |
| 2017 Footnote 4 | 478.3 |
| 2018 | 466.8 |
| 2019 | 471.2 |
| 2020 | 481.9 |
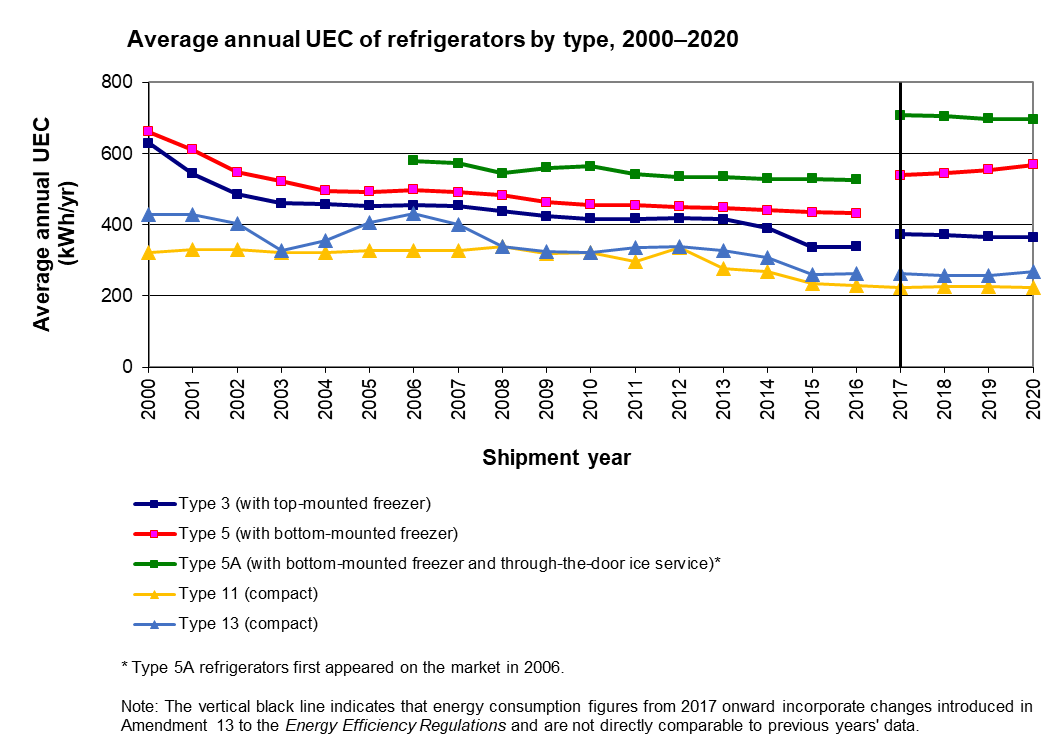
Refrigerator types
The market share of different refrigerator types has implications for energy consumption.
Amendment 13 to the Energy Efficiency Regulations changed the test procedure for refrigerators, which makes 2017 and after UEC numbers difficult to compare with UEC numbers of 2016 and earlier. Regardless, there is a general trend of decreased energy consumption of all refrigerator types up to 2016. If we extend the review period to 2020, we see that all but one type (Type 5 with bottom-mounted freezer) of refrigerator has declining energy consumption.
Text version
Average annual UEC of refrigerators by type, 2000–2020 (kWh/yr)
| Shipment year | Type 3 (with top-mounted freezer) | Type 5 (with bottom-mounted freezer) | Type 5A (with bottom-mounted freezer and through-the-door ice service) Footnote 1 | Type 11 (compact) | Type 13 (compact) |
|---|---|---|---|---|---|
| 2000 | 629.3 | 660.9 | 323.4 | 430.0 | |
| 2001 | 544.1 | 610.2 | 330.6 | 430.0 | |
| 2002 | 485.6 | 547.0 | 331.1 | 405.0 | |
| 2003 | 460.8 | 522.4 | 323.1 | 326.7 | |
| 2004 | 458.4 | 496.0 | 321.3 | 356.7 | |
| 2005 | 453.8 | 493.2 | 327.8 | 406.6 | |
| 2006 | 455.4 | 497.9 | 580.1 | 328.6 | 431.1 |
| 2007 | 453.5 | 490.8 | 572.7 | 328.3 | 400.2 |
| 2008 | 437.7 | 482.6 | 545.4 | 338.1 | 340.3 |
| 2009 | 424.4 | 462.9 | 560.0 | 318.1 | 325.5 |
| 2010 | 417.0 | 456.3 | 564.3 | 322.2 | 323.4 |
| 2011 | 417.1 | 454.6 | 542.0 | 297.5 | 336.6 |
| 2012 | 418.0 | 450.9 | 534.7 | 335.6 | 337.8 |
| 2013 | 415.0 | 448.0 | 534.6 | 278.1 | 326.7 |
| 2014 | 389.6 | 441.2 | 529.8 | 269.1 | 306.8 |
| 2015 | 336.3 | 434.6 | 528.8 | 234.6 | 260.0 |
| 2016 | 337.8 | 432.9 | 526.1 | 229.2 | 261.8 |
| 2017 Footnote 2 | 373.0 | 538.5 | 708.5 | 223.3 | 264.2 |
| 2018 | 371.8 | 544.9 | 704.9 | 226.1 | 258.1 |
| 2019 | 366.7 | 555.0 | 698.6 | 226.5 | 258.3 |
| 2020 | 365.3 | 569.0 | 696.7 | 223.2 | 267.6 |
Refrigerator capacity
The capacity of refrigerators shipped in Canada increased significantly from 2000 to 2020.
In 2000, 31% of standard refrigerators Footnote 3 had a volume of 18.5 cu. ft. or larger and only 3% of them were 24.5 cu. ft. or larger. By 2020, 57% of standard refrigerators had a volume of 18.5 cu. ft. or larger, and 20% of them were 24.5 cu. ft. or larger. Very large refrigerators (those above 26.5 cu. ft.) first started appearing on the market in 2010 and their market share grew to 8% in 2020.
Text version
Distribution of standard-size refrigerators by volume, 2000–#nDataYear# (%)
| Shipment year | Volume (cu. ft.) | |||||||||
|---|---|---|---|---|---|---|---|---|---|---|
| 10.5–12.4 | 12.5–14.4 | 14.5–16.4 | 16.5–18.4 | 18.5–20.4 | 20.5–22.4 | 22.5–24.4 | 24.5–26.4 | 26.5–28.4 | ≥28.5 | |
| 2000 | 7.0 | 8.2 | 9.7 | 44.1 | 9.9 | 16.4 | 2.0 | 2.2 | 0.5 | 0.1 |
| 2001 | 6.1 | 7.3 | 9.5 | 39.6 | 12.4 | 18.0 | 3.3 | 3.0 | 0.7 | 0.1 |
| 2002 | 5.9 | 7.9 | 7.2 | 36.9 | 16.3 | 17.4 | 3.7 | 3.8 | 0.8 | 0.2 |
| 2003 | 4.1 | 6.4 | 9.0 | 38.8 | 16.5 | 17.7 | 3.2 | 3.6 | 0.7 | 0.1 |
| 2004 | 3.2 | 3.5 | 11.6 | 41.6 | 15.2 | 16.9 | 3.1 | 4.6 | 0.2 | 0.1 |
| 2005 | 2.7 | 2.5 | 10.4 | 44.8 | 16.3 | 14.8 | 3.1 | 5.4 | 0.0 | 0.1 |
| 2006 | 3.7 | 2.6 | 10.0 | 41.3 | 17.8 | 14.7 | 3.6 | 6.3 | 0.0 | 0.1 |
| 2007 | 3.3 | 2.3 | 8.9 | 40.5 | 17.6 | 14.9 | 4.0 | 8.4 | 0.0 | 0.1 |
| 2008 | 4.0 | 2.3 | 6.5 | 40.1 | 22.4 | 12.6 | 4.8 | 7.0 | 0.0 | 0.1 |
| 2009 | 5.4 | 1.7 | 7.1 | 40.8 | 22.6 | 10.5 | 5.0 | 6.4 | 0.2 | 0.4 |
| 2010 | 5.2 | 1.5 | 6.3 | 39.7 | 23.0 | 11.3 | 5.1 | 5.9 | 1.1 | 0.9 |
| 2011 | 3.9 | 1.0 | 5.4 | 42.5 | 21.0 | 12.0 | 4.4 | 6.2 | 3.3 | 0.4 |
| 2012 | 5.3 | 0.9 | 5.3 | 38.2 | 20.7 | 12.9 | 4.6 | 7.5 | 3.9 | 0.8 |
| 2013 | 6.0 | 0.8 | 5.2 | 34.9 | 20.5 | 14.6 | 4.9 | 7.4 | 4.1 | 1.6 |
| 2014 | 5.8 | 0.8 | 8.2 | 31.3 | 16.4 | 17.6 | 6.2 | 7.2 | 3.0 | 3.5 |
| 2015 | 7.3 | 1.3 | 11.5 | 26.1 | 15.4 | 17.2 | 7.8 | 7.1 | 2.9 | 3.4 |
| 2016 | 7.0 | 1.3 | 9.4 | 25.6 | 13.8 | 19.4 | 8.5 | 8.3 | 3.6 | 3.1 |
| 2017 | 6.7 | 1.4 | 6.9 | 22.2 | 15.3 | 22.5 | 8.3 | 10.3 | 3.4 | 3.0 |
| 2018 | 8.2 | 1.4 | 8.5 | 27.6 | 12.9 | 19.2 | 6.7 | 9.0 | 4.1 | 2.3 |
| 2019 | 7.7 | 2.5 | 6.9 | 28.3 | 12.6 | 19.7 | 6.3 | 10.5 | 4.7 | 1.3 |
| 2020 | 8.2 | 4.3 | 3.9 | 26.3 | 13.1 | 20.9 | 3.7 | 11.5 | 7.2 | 0.9 |
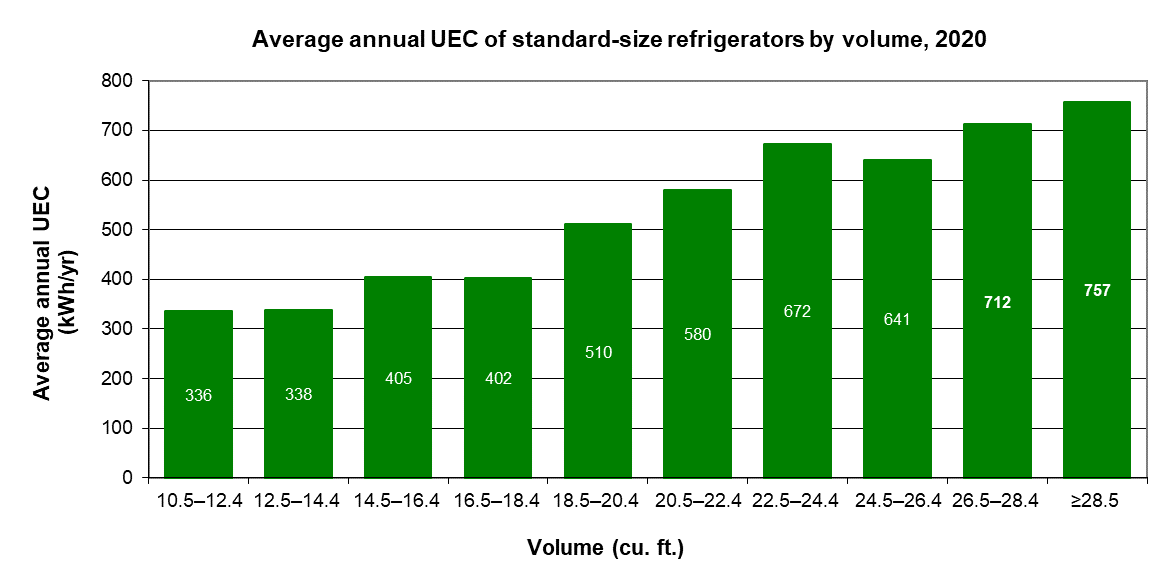
The larger the refrigerator capacity, the more energy it consumes.
Text version
Average annual UEC of standard-size refrigerators by volume, #nDataYear# (kWh/yr)
| Shipment year | Volume (cu. ft.) | |||||||||
|---|---|---|---|---|---|---|---|---|---|---|
| 10.5–12.4 | 12.5–14.4 | 14.5–16.4 | 16.5–18.4 | 18.5–20.4 | 20.5–22.4 | 22.5–24.4 | 24.5–26.4 | 26.5–28.4 | ≥28.5 | |
| #nDataYear# | 336 | 338 | 405 | 402 | 510 | 580 | 672 | 641 | 712 | 757 |
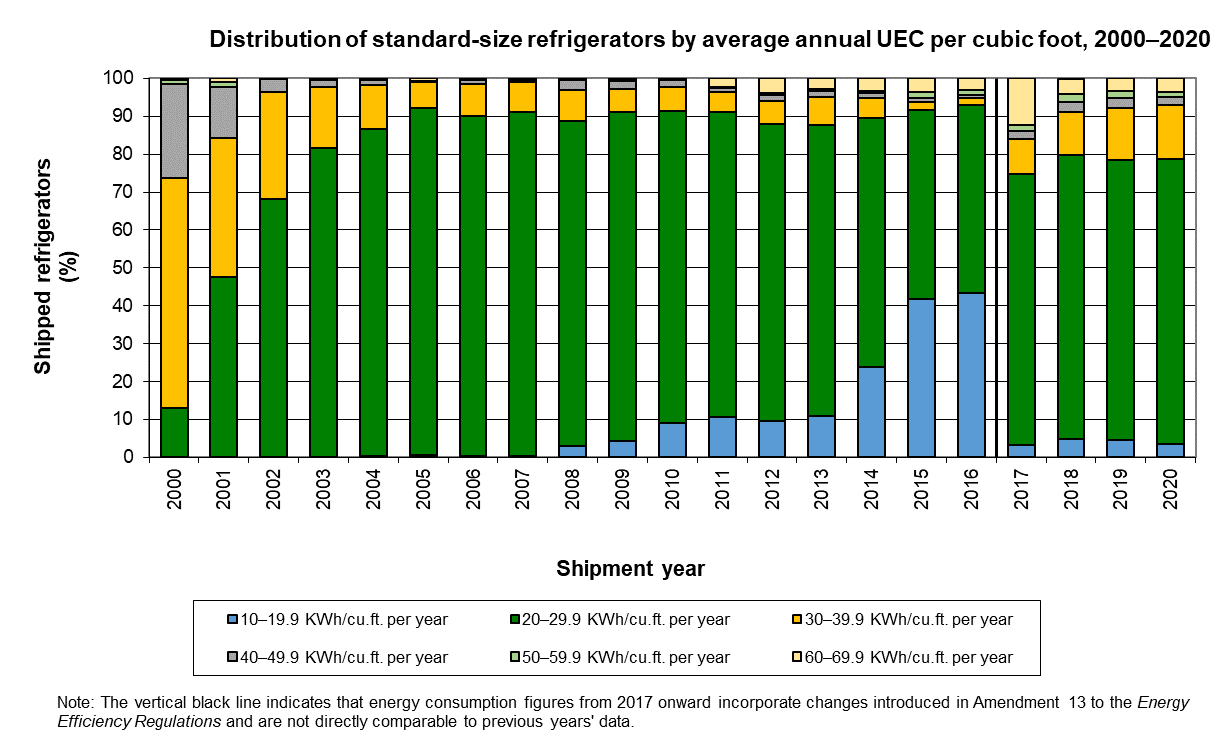
Annual energy consumption per volume
Although the average annual UEC of refrigerators shipped between 2000 and 2020 decreased, the energy consumption per unit volume decreased even more because of the higher efficiency gains of larger refrigerators. Footnote 4 In 2020, 78.7% of shipped refrigerators consumed less than 30 kWh/cu. ft. per year. Footnote 5
Text version
Distribution of standard-size refrigerators by average annual UEC per cubic foot, 2000–2020 (%)
| Shipment year | Average Annual Unit Energy Consumption (UEC) (kWh/cu. ft. per year) | |||||
|---|---|---|---|---|---|---|
| 10–19.9 | 20–29.9 | 30–39.9 | 40–49.9 | 50–59.9 | 60–69.9 | |
| 2000 | 0.0 | 12.9 | 60.6 | 24.9 | 1.0 | 0.5 |
| 2001 | 0.0 | 47.5 | 36.8 | 13.5 | 1.4 | 0.9 |
| 2002 | 0.0 | 68.2 | 28.2 | 3.3 | 0.2 | 0.0 |
| 2003 | 0.1 | 81.6 | 16.2 | 1.7 | 0.2 | 0.2 |
| 2004 | 0.4 | 86.3 | 11.5 | 1.3 | 0.2 | 0.2 |
| 2005 | 0.6 | 91.5 | 6.9 | 0.2 | 0.2 | 0.6 |
| 2006 | 0.4 | 89.6 | 8.7 | 0.9 | 0.3 | 0.2 |
| 2007 | 0.4 | 90.7 | 7.9 | 0.6 | 0.4 | 0.1 |
| 2008 | 3.1 | 85.7 | 8.2 | 2.6 | 0.3 | 0.1 |
| 2009 | 4.2 | 86.8 | 6.2 | 2.2 | 0.5 | 0.1 |
| 2010 | 9.2 | 82.1 | 6.5 | 1.7 | 0.4 | 0.1 |
| 2011 | 10.6 | 80.5 | 5.3 | 1.0 | 0.4 | 2.1 |
| 2012 | 9.5 | 78.4 | 6.1 | 1.7 | 0.5 | 3.9 |
| 2013 | 10.8 | 76.9 | 7.4 | 1.7 | 0.5 | 2.7 |
| 2014 | 23.8 | 65.6 | 5.4 | 1.2 | 0.6 | 3.4 |
| 2015 | 41.9 | 49.8 | 2.2 | 0.8 | 1.7 | 3.6 |
| 2016 | 43.3 | 49.5 | 2.1 | 0.7 | 1.2 | 3.2 |
| 2017 Footnote 1 | 3.4 | 71.3 | 9.2 | 2.3 | 1.5 | 12.3 |
| 2018 | 4.8 | 75.0 | 11.3 | 2.7 | 2.2 | 3.8 |
| 2019 | 4.5 | 73.9 | 13.9 | 2.5 | 2.0 | 3.2 |
| 2020 | 3.6 | 75.1 | 14.4 | 2.0 | 1.4 | 3.6 |