Energy Consumption of Clothes Dryers

Key facts
- In May 2014, the U.S. Environmental Protection Agency announced the introduction of ENERGY STAR certified residential clothes dryers. ENERGY STAR certified clothes dryers use innovative energy-saving technologies to save more electricity than conventional clothes dryers.
- The average drum capacity of clothes dryers increased 14% from 2000 to 2020. Conversely, the average energy consumption per drum litre decreased by 43%.
- Consumers are now drying more clothes per load and each load is consuming less energy.
Average annual unit energy consumption (UEC)
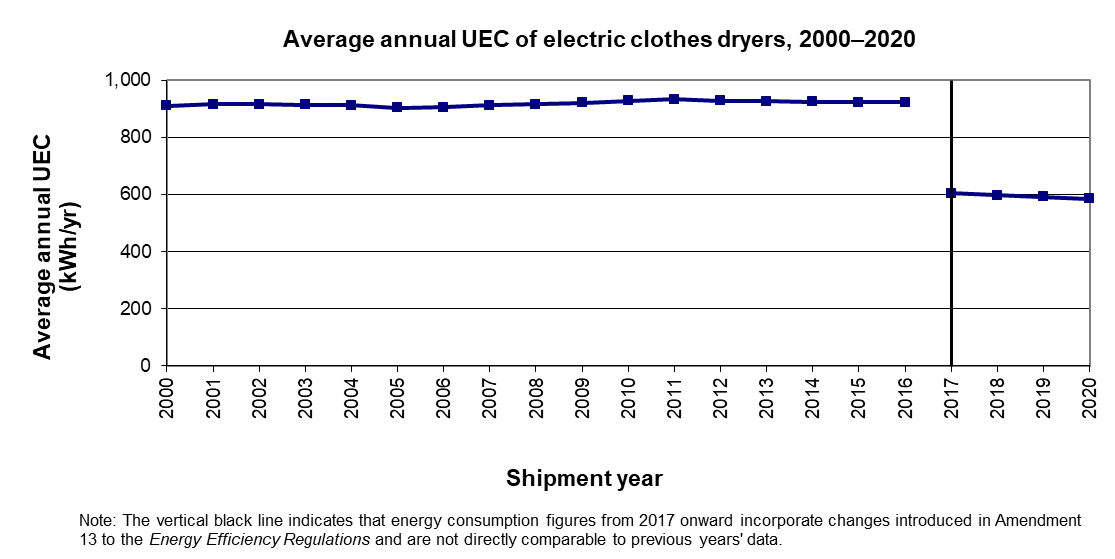
The average annual unit energy consumption (UEC) of clothes dryers was 35% lower in 2020 than in 2000. This significant decrease is a reflection of changes to the test procedures used to measure energy efficiency, which were updated as a result of amendments to the Energy Efficiency Regulations that came into force in 2017 Footnote 1 . The data for 2017 onward are not directly comparable to previous years’ data because the test procedures were updated.
Text version
Average annual UEC of electric clothes dryers, 2000–2020 (kWh/yr)
| Shipment year | Average Annual Unit Energy Consumption (UEC) (kWh/yr) |
|---|---|
| 2000 | 909.8 |
| 2001 | 916.3 |
| 2002 | 915.6 |
| 2003 | 914.2 |
| 2004 | 911.9 |
| 2005 | 903.8 |
| 2006 | 904.6 |
| 2007 | 912.1 |
| 2008 | 916.0 |
| 2009 | 921.4 |
| 2010 | 928.0 |
| 2011 | 932.9 |
| 2012 | 928.5 |
| 2013 | 926.4 |
| 2014 | 924.2 |
| 2015 | 923.3 |
| 2016 | 922.9 |
| 2017 Footnote 1 | 604.8 |
| 2018 | 597.0 |
| 2019 | 591.5 |
| 2020 | 584.5 |
The increasing market share of front-loading clothes washers has helped reduce the average energy consumed by clothes dryers because front-loading clothes washers remove more moisture from clothes than top-loading clothes washers do. Less moisture in the clothes means that less energy is required to dry the clothes. The effect of front-loading clothes washers on the energy consumed by clothes dryers is not reflected in the UEC data.
Moisture detectors in clothes dryers reduce energy consumption by automatically shutting off when a load is dry.
Distribution of shipped clothes dryers by unit energy consumption
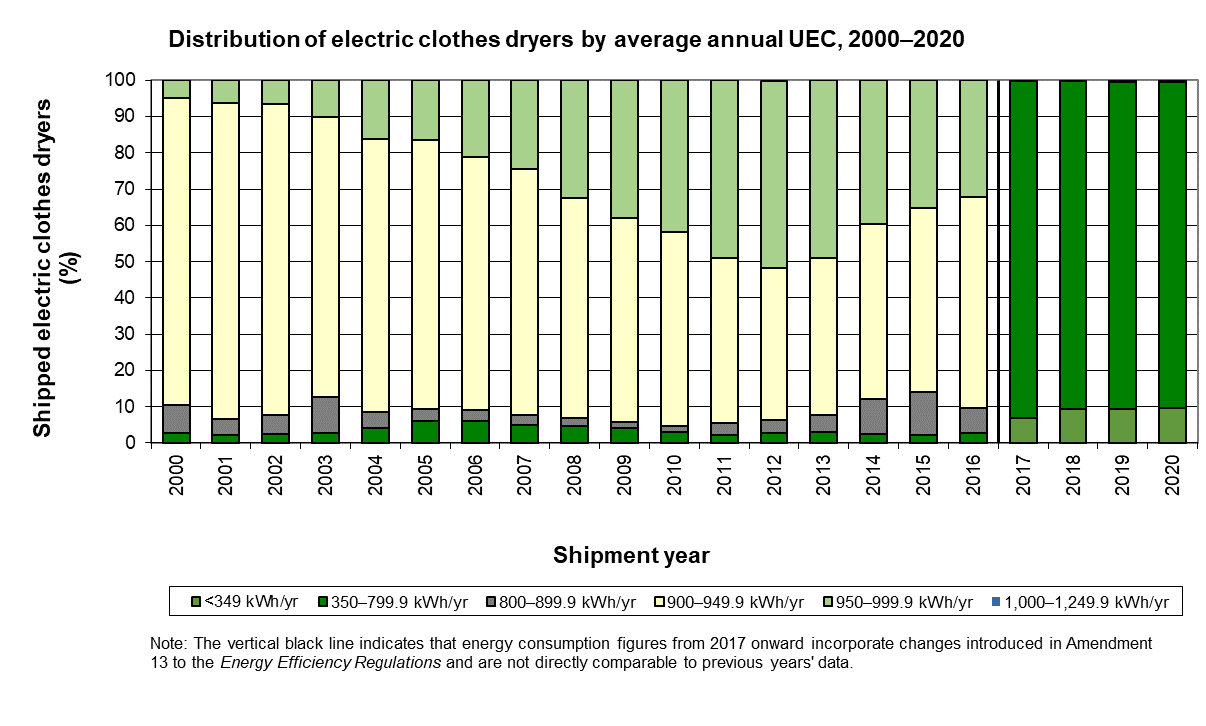
In 2000, 89.6% of electric clothes dryers consumed more than 900 kWh/yr, whereas by 2020, 99.6% consumed less than 800 kWh/yr. As previously noted, this is due to changes to the test procedures used to measure energy efficiency, which were updated as a result of amendments to the Energy Efficiency Regulations that came into force in 2017. The data for 2017 onward are not directly comparable to previous years’ data because the test procedures were updated.
Text version
Distribution of electric clothes dryers by average annual UEC, 2000–2020 (%)
| Shipment year | Average Annual Unit Energy Consumption (UEC) (kWh/yr) | |||||
|---|---|---|---|---|---|---|
| <350 | 350–799.9 | 800–899.9 | 900–949.9 | 950–999.9 | 1,000–1,249.9 | |
| 2000 | 0.0 | 2.7 | 7.7 | 84.6 | 5.0 | 0.0 |
| 2001 | 0.0 | 2.3 | 4.3 | 87.1 | 6.3 | 0.0 |
| 2002 | 0.0 | 2.5 | 5.2 | 85.5 | 6.7 | 0.0 |
| 2003 | 0.0 | 2.7 | 10.0 | 77.0 | 10.3 | 0.0 |
| 2004 | 0.0 | 4.0 | 4.4 | 75.3 | 16.3 | 0.0 |
| 2005 | 0.0 | 6.1 | 3.2 | 74.1 | 16.6 | 0.0 |
| 2006 | 0.0 | 6.1 | 2.8 | 69.8 | 21.2 | 0.0 |
| 2007 | 0.0 | 4.9 | 2.9 | 67.8 | 24.4 | 0.0 |
| 2008 | 0.0 | 4.6 | 2.2 | 60.7 | 32.5 | 0.0 |
| 2009 | 0.0 | 4.2 | 1.7 | 56.1 | 38.1 | 0.0 |
| 2010 | 0.0 | 3.0 | 1.7 | 53.4 | 41.9 | 0.0 |
| 2011 | 0.0 | 2.1 | 3.3 | 45.5 | 49.1 | 0.0 |
| 2012 | 0.0 | 2.8 | 3.5 | 42.0 | 51.6 | 0.0 |
| 2013 | 0.0 | 3.1 | 4.5 | 43.4 | 49.0 | 0.0 |
| 2014 | 0.0 | 2.4 | 9.8 | 48.1 | 39.7 | 0.0 |
| 2015 | 0.0 | 2.3 | 11.6 | 50.9 | 35.2 | 0.0 |
| 2016 | 0.0 | 2.7 | 6.9 | 58.2 | 32.3 | 0.0 |
| 2017 Footnote 1 | 6.8 | 93.1 | 0.0 | 0.1 | 0.0 | 0.0 |
| 2018 | 9.3 | 90.4 | 0.0 | 0.3 | 0.0 | 0.0 |
| 2019 | 9.5 | 90.1 | 0.0 | 0.4 | 0.0 | 0.0 |
| 2020 | 9.5 | 90.0 | 0.0 | 0.4 | 0.0 | 0.0 |
Drum capacity
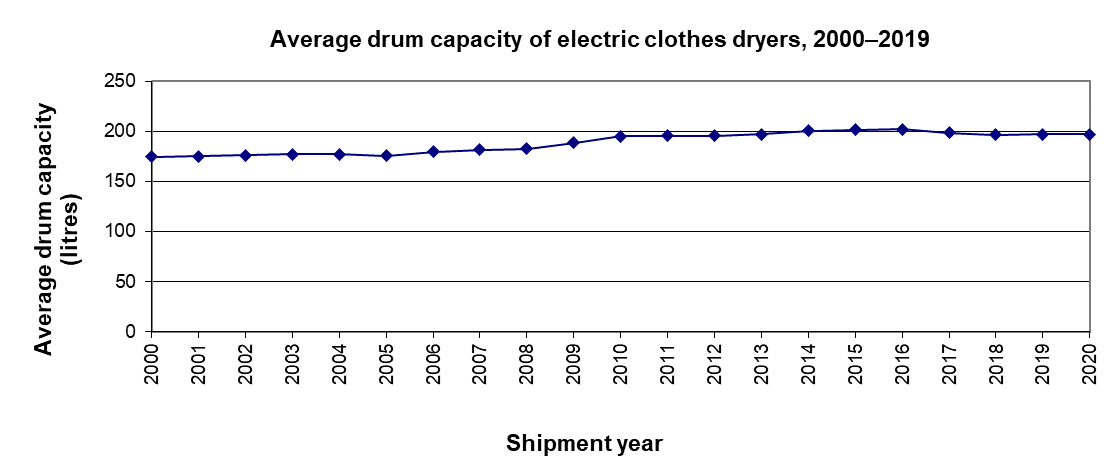
The increase in the shipment share of more energy-intensive electric clothes dryers is due mainly to the growing average drum capacity of electric clothes dryers. The average drum capacity of electric clothes dryers increased by 13% from 2000 to 2020. Conversely, the average energy consumption per drum litre has decreased at a faster rate during the same period (43%) Footnote 2 . Consumers are drying more clothes per load, but each load is consuming less energy per unit of dryer volume.
Text version
Average drum capacity of electric clothes dryers, 2000–#nDataYear# (litres)
| Shipment year | Average drum capacity (litres) |
|---|---|
| 2000 | 174.68 |
| 2001 | 175.27 |
| 2002 | 176.30 |
| 2003 | 177.10 |
| 2004 | 176.85 |
| 2005 | 175.44 |
| 2006 | 179.72 |
| 2007 | 181.39 |
| 2008 | 182.76 |
| 2009 | 188.34 |
| 2010 | 194.80 |
| 2011 | 195.30 |
| 2012 | 195.70 |
| 2013 | 196.80 |
| 2014 | 200.50 |
| 2015 | 201.26 |
| 2016 | 202.10 |
| 2017 | 198.30 |
| 2018 | 196.30 |
| 2019 | 196.97 |
| 2020 | 196.94 |
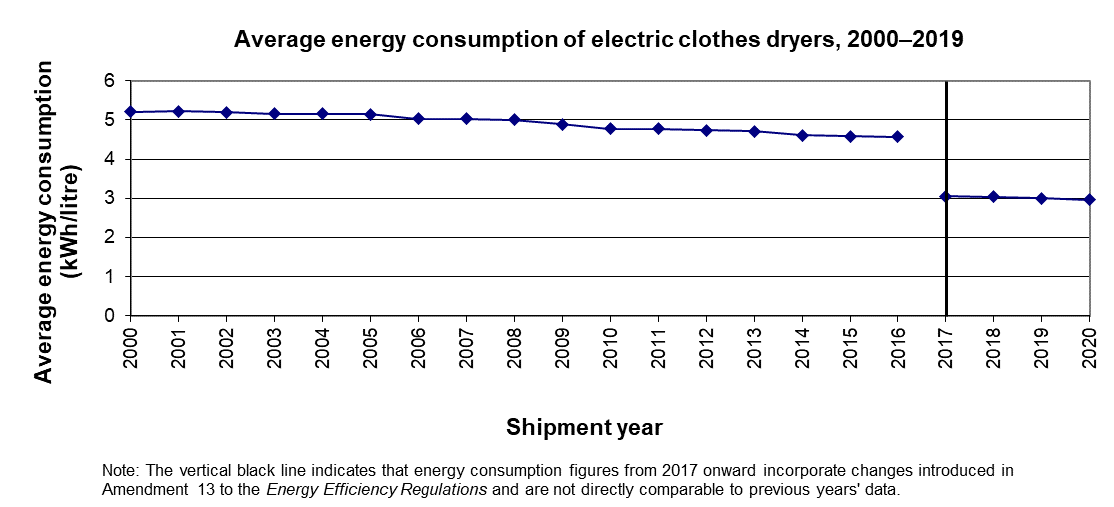
Text version
Average energy consumption of electric clothes dryers, 2000–2020 (kWh/litre)
| Shipment year | Average energy consumption (kWh/litre) |
|---|---|
| 2000 | 5.21 |
| 2001 | 5.23 |
| 2002 | 5.19 |
| 2003 | 5.16 |
| 2004 | 5.16 |
| 2005 | 5.15 |
| 2006 | 5.03 |
| 2007 | 5.03 |
| 2008 | 5.01 |
| 2009 | 4.89 |
| 2010 | 4.78 |
| 2011 | 4.78 |
| 2012 | 4.74 |
| 2013 | 4.71 |
| 2014 | 4.61 |
| 2015 | 4.59 |
| 2016 | 4.57 |
| 2017 Footnote 1 | 3.05 |
| 2018 | 3.04 |
| 2019 | 3.00 |
| 2020 | 2.97 |