Survey of Household Energy Use, 2015

The Survey of Household Energy Use (SHEU) is a joint project between Statistics Canada and Natural Resources Canada (NRCan). It collects data on household energy use in homes and residential buildings across Canada. This report provides highlights from the survey and insights on household energy use and energy efficiencies.
The SHEU gathers information on energy use and factors affecting energy use in households, which assists in the delivery of programs to support Canadians as they seek to achieve greater energy efficiency and reduce their greenhouse gas (GHG) footprint. In 2015, about 14.2 million Canadian households consumed 1.4 billion gigajoules (GJ) of energy to power activities inside the home, with the average Canadian household consuming just under 100 GJ of energy. This is a decrease of just over 5% from the 2011 SHEU, demonstrating that energy efficiency has helped curb the increase in energy use arising from higher activity levels, more appliances, and slightly colder temperatures in the home.
Household
Energy Use
Household Energy Use in 2015
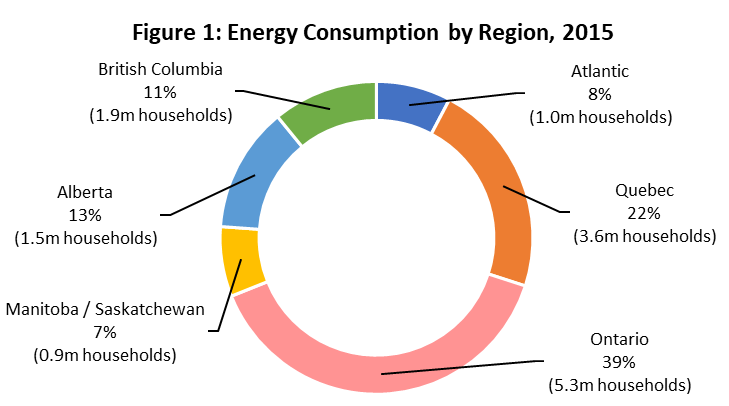
- Canadians used more than 1.4 billion GJ of energy, an decrease of approximately 20 million GJ from 2011. Ontario was the most energy-consuming province with 549.7 million GJ (39%) of energy use, but saw a decrease of 14.8 million GJ from 2011.
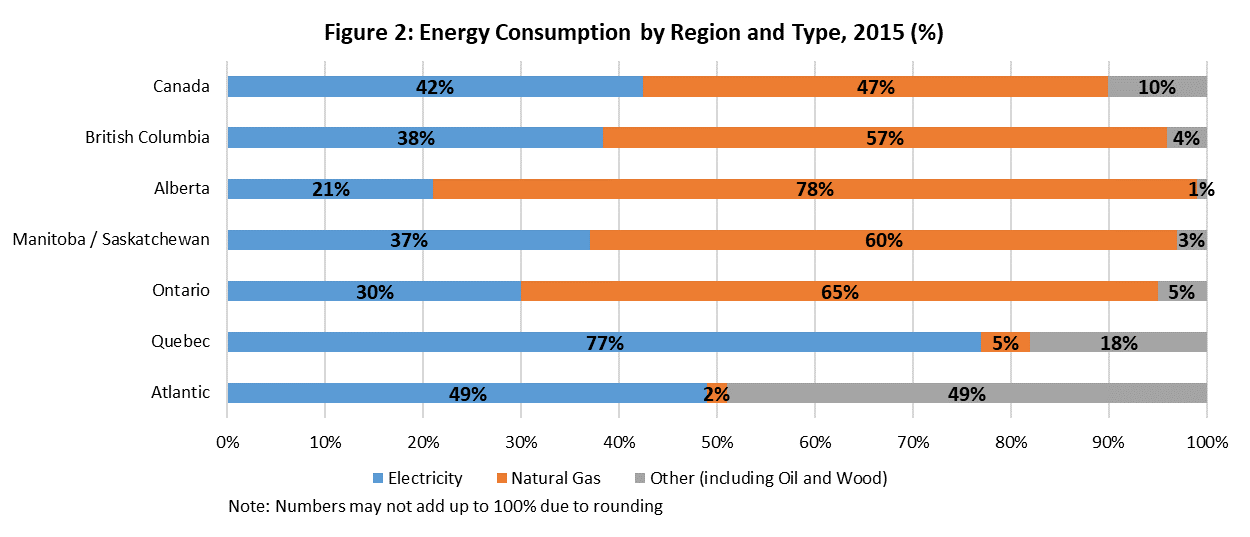
- Natural gas was the most consumed fuel with 670.3 million GJ (47%) used in Canada, followed by electricity with 594.6 million GJ (42%), and oil/wood 146.8 million GJ (10%).
- Quebec was the largest consumer of electricity (240.4 million GJ, 40%) and oil/wood (56.8 million GJ, 39%).
- Ontario, the largest consumer of natural gas with 359.1 million GJ (54%)%), used more than the rest of Canada.
- The Atlantic region utilized the least amount of natural gas, using 1.8 million GJ.
- Oil and wood are not generally popular fuels in regions across the country, with the exception of the Atlantic provinces where they make up 49% of consumption. This is especially true in Alberta, where oil and wood account for only a little over 1 million GJ.
Text version
Figure 1: Energy consumption by region, 2015
| Region | Energy consumption (%) | Number of households (million) |
|---|---|---|
| Atlantic | 8 | 1.0 |
| Quebec | 22 | 3.6 |
| Ontario | 39 | 5.3 |
| Manitoba/Saskatchewan | 7 | 0.9 |
| Alberta | 13 | 1.5 |
| British Columbia | 11 | 1.9 |
Text version
Figure 2: Energy consumption by region and type, 2015 (%)
| Region | Electricity | Natural Gas | Other (including Oil and Wood) |
|---|---|---|---|
| Canada | 42 | 47 | 10 |
| British Columbia | 38 | 57 | 4 |
| Alberta | 21 | 78 | 1 |
| Manitoba/Saskatchewan | 37 | 60 | 3 |
| Ontario | 30 | 65 | 5 |
| Quebec | 77 | 5 | 18 |
| Atlantic | 49 | 2 | 49 |
Household
Characteristics
General Characteristics of Canadian Households
- There were 14.1 million households in Canada, an increase of 0.5 million from 2011. Ontario had the most with 5.3 million households. Manitoba/Saskatchewan had the fewest with 908.8 thousand.
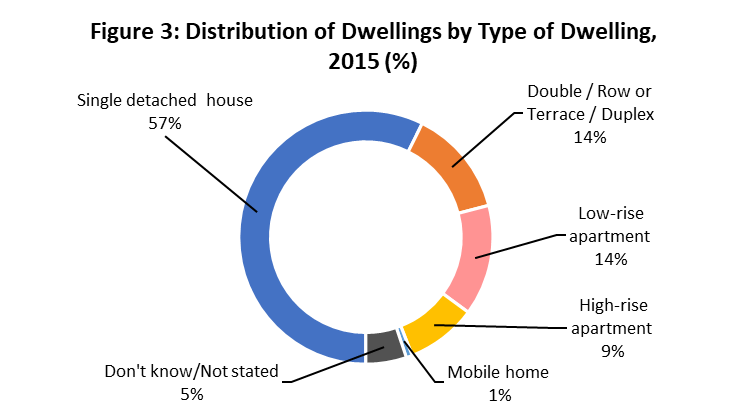
- Single detached houses were the most common type of dwelling in Canada. Mobile homes were the least common.
- Two-person households were the most common (34%) followed by one-person households (28%).
- Households with members aged 65 or over was the most common age demographic (23%).
- The average heated area per household was 194.8 m2, an increase from 189.3 m2 in 2011. Alberta had the largest average heated area with 207.4 m2 and Quebec was the smallest with 175.3 m2.
Text version
Figure 3: Distribution of Dwellings by Type, 2015 (%)
| Type of Dwelling | Percent |
|---|---|
| Single detached house | 57 |
| Double / Row or Terrace / Duplex | 14 |
| Low-rise apartment | 14 |
| High-rise apartment | 9 |
| Mobile home | 1 |
| Don’t know/Not stated | 5 |
Text version
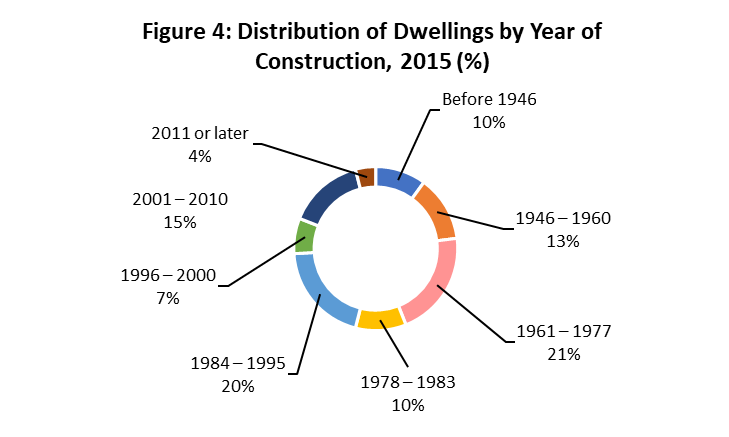
Figure 4: Distribution of Dwellings by Year of Construction, 2015 (%)
| Year of Construction | Percent |
|---|---|
| Before 1946 | 10 |
| 1946 – 1960 | 13 |
| 1961 – 1977 | 21 |
| 1978 – 1983 | 10 |
| 1984 – 1995 | 20 |
| 1996 – 2000 | 7 |
| 2001 – 2010 | 15 |
| 2011 or later | 4 |
Energy
Intensity
Energy Intensity
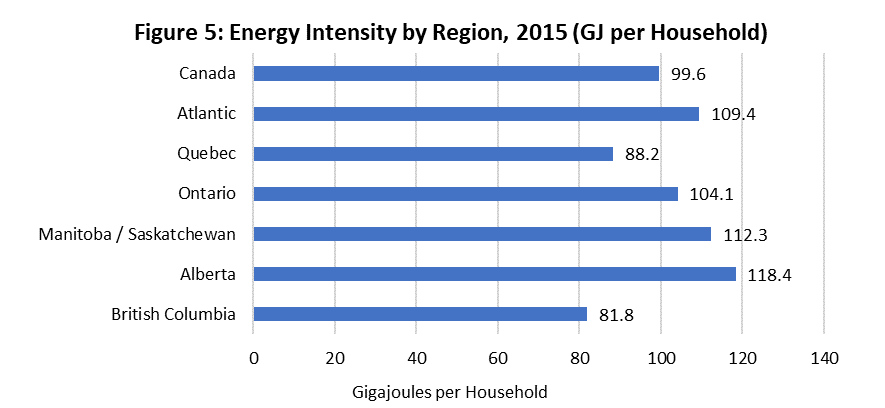
- Alberta had the highest energy intensity, with 118.4 GJ per household. British Columbia had the lowest with 81.8 GJ per household. The national average was 99.6 GJ per household, a decrease from 105.3 GJ per household from 2011.
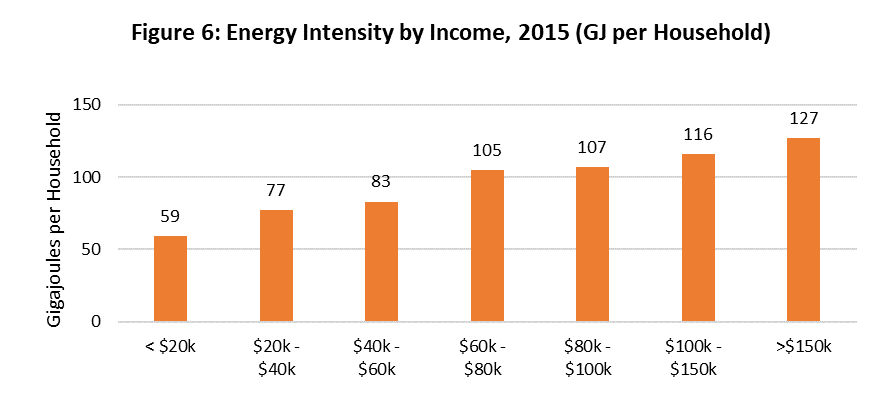
- In Canada, household income is positively correlated with energy intensity.
- By dwelling type, single detached homes consumed the most energy with 124.3 GJ per household and apartments sharing common walls were the least energy consuming dwelling type (37.6 GJ per household).
- Quebec households consumed the most electricity with 67.5 GJ per household, which is more than double the consumption in Alberta (24.9 GJ per household). The national average was 42 GJ per household.
- Households that owned their dwelling had a higher energy intensity (114.4 GJ per household) than renters (58.4 GJ per household).
Text version
Figure 5: Energy Intensity by Region, 2015 (GJ per Household)
| Region | Energy Intensity (GJ per Household) |
|---|---|
| Canada | 99.6 |
| Atlantic | 109.4 |
| Quebec | 88.2 |
| Ontario | 104.1 |
| Manitoba/Saskatchewan | 112.3 |
| Alberta | 118.4 |
| British Columbia | 81.8 |
Text version
Figure 6: Energy Intensity by Income, 2015 (GJ per Household)
| Income Level | Energy Intensity (GJ per Household) |
|---|---|
| <$20k | 59 |
| $20k – $40k | 77 |
| $40k – $60k | 83 |
| $60k – $80k | 105 |
| $80k – $100k | 107 |
| $100k – $150k | 116 |
| >$150k | 127 |
Energy Intensity by Heated Area
- Manitoba/Saskatchewan had the highest energy intensity per heated area with 0.59 GJ/m2. The national average was 0.51 GJ/m2 (decline of 0.5 GJ/m2 from 2011) while the least energy intensive province was British Columbia with 0.44 GJ/m2.
- Renters consumed more energy per heated area (0.59 GJ/m2) than owners did (0.51 GJ/m2).
Household
Improvements
Major Household Improvements
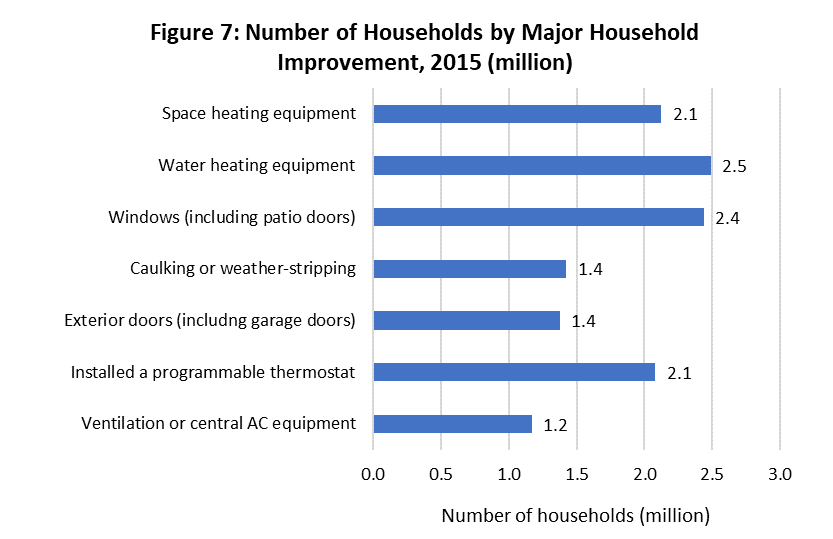
- Over the last 10 years, approximately 1.9 million Canadian households participated in an energy audit, with 1.4 million households making changes as a result.
- Since 2010, a little over 6 million households made improvements that reduced energy consumption.
- The most common dwelling improvement was with water heating equipment, followed by improvements to windows.
- The most common reason (55%) that Canadians gave regarding not making dwelling improvements was that they felt no improvements were necessary.
- Approximately 929 thousand households received a government grant as a part of a retrofit program.
Text version
Figure 7: Number of Households by Major Household Improvement, 2015 (million)
| Major Household Improvement | Number of Households (million) |
|---|---|
| Space heating equipment | 2.1 |
| Water heating equipment | 2.5 |
| Windows (including patio doors) | 2.4 |
| Caulking or weather-stripping | 1.4 |
| Exterior doors (includng garage doors) | 1.4 |
| Installed a programmable thermostat | 2.1 |
| Ventilation or central AC equipment | 1.2 |
Heating
Systems
Heating Systems
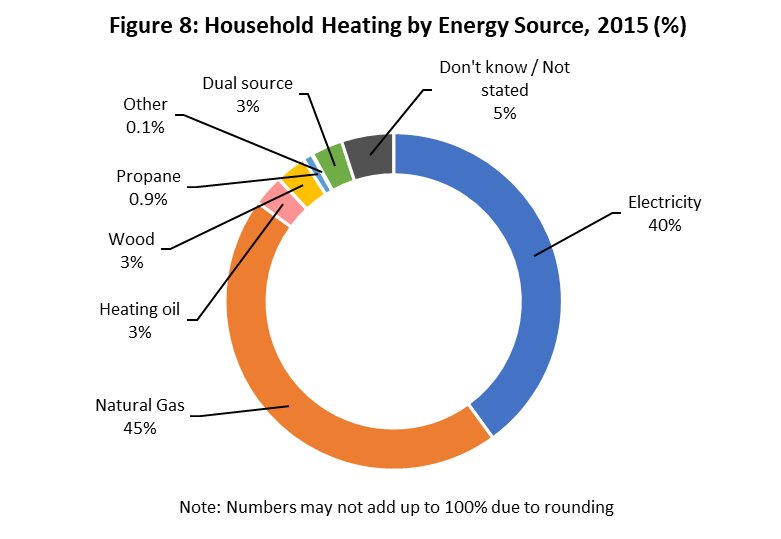
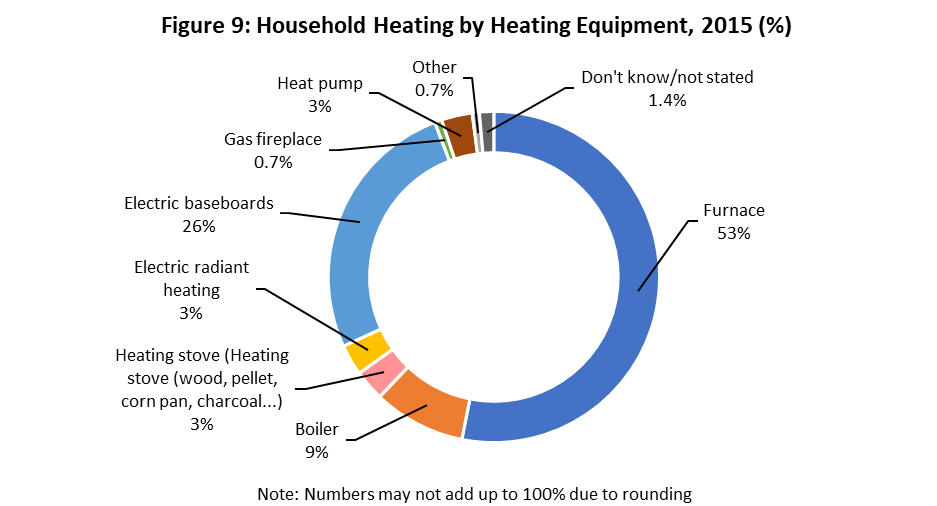
- The most common main energy source for heating was natural gas (43%), followed by electricity (41%), then heating oil (3%).
- Furnaces were the most common main heating equipment with a 53% share in Canadian households. Approximately 3.3 million furnaces were identified to be Energy Star rated, an increase of 1.3 million furnaces since 2011.
- Around 5.3 million households (37%) have a supplemental heating system, with gas fireplace being the most common.
- Canadian households preferred to have their indoor temperature between 20 and 22 degrees Celsius when present and awake.
Text version
Figure 8: Household Heating by Energy Source Footnote 1 , 2015 (%)
| Main Energy Source | Percent |
|---|---|
| Electricity | 40 |
| Natural Gas | 45 |
| Heating Oil | 3 |
| Wood | 3 |
| Propane | 0.9 |
| Other | 0.1 |
| Dual Source | 3 |
| Don’t know / Not stated | 5 |
Text version
Figure 9: Household Heating by Heating Equipment, 2015 (%)
| Main Heating Equipment | Percent |
|---|---|
| Furnace | 53 |
| Boiler | 9 |
| Heating stove (wood, pellet, corn pan, charcoal…) | 3 |
| Electric radiant heating | 3 |
| Electric baseboards | 26 |
| Gas fireplace | 0.7 |
| Heat pump | 3 |
| Other | 0.7 |
| Don’t know/Not stated | 1.4 |
Appliances
Appliances
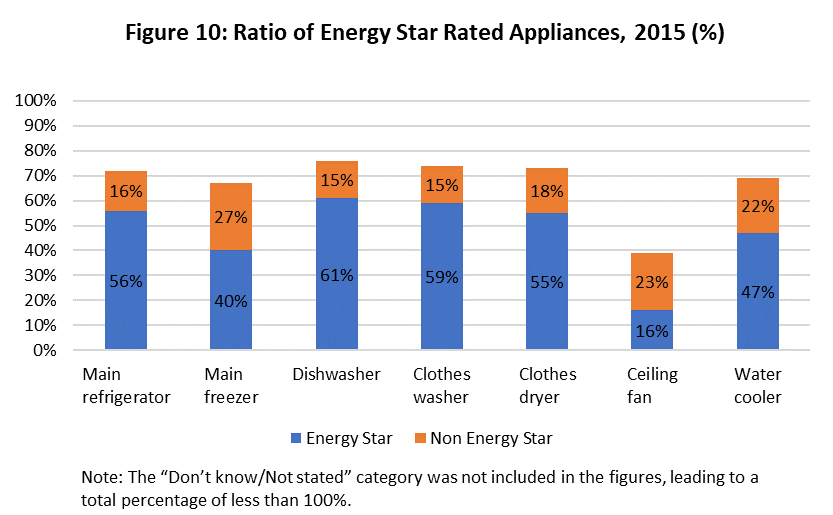
- With the exception of main freezers, ceiling fans, and water coolers, the majority of major appliances were Energy Star rated.
- A little over 4.2 million households have a second refrigerator, while 332 thousand households have three or more.
- Electricity was the most common energy source for cooking appliances, with 11.6 million households.
Text version
Figure 10: Ratio of Energy Star Rated Appliances, 2015 (%)
| Appliance | Energy Star | Non Energy Star |
|---|---|---|
| Main refrigerator | 56 | 16 |
| Main freezer | 40 | 27 |
| Dishwasher | 61 | 15 |
| Clothes washer | 59 | 15 |
| Clothes dryer | 55 | 18 |
| Ceiling fan | 16 | 23 |
| Water cooler | 47 | 22 |
Electronic
Devices
Electronic Devices
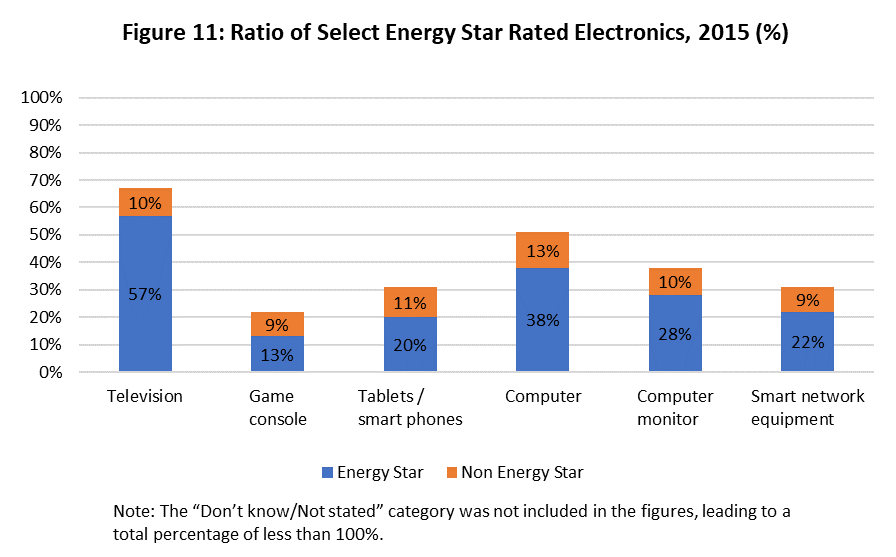
- Energy Star was not as prevalent for electronic devices. Televisions were the only electronic device to have an Energy Star prevalence of over 50% in Canadian households.
- 8.9 million households (63%) had portable media/smartphones in their homes.
Text version
Figure 11: Ratio of Select Energy Star Rated Electronics, 2015 (%)
| Device | Energy Star | Non Energy Star |
|---|---|---|
| Television | 57 | 10 |
| Game console | 13 | 9 |
| Tablets / smart phones | 20 | 11 |
| Computer | 38 | 13 |
| Computer monitor | 28 | 10 |
| Smart network equipment | 22 | 9 |
Lighting
Lighting
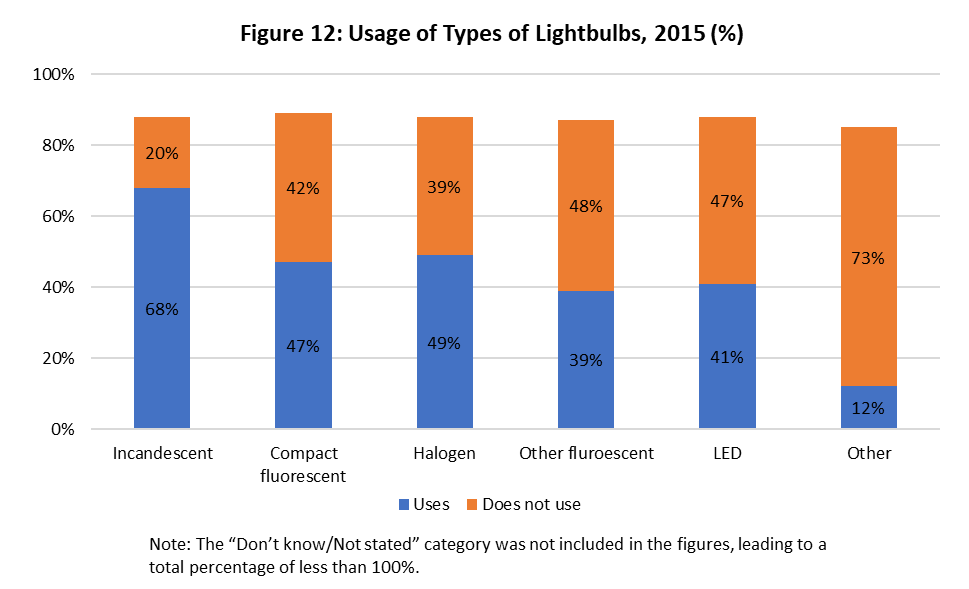
- Incandescent lightbulbs were the most commonly used lightbulb across Canada, with 9.7 million households using them.
- The number of households using light emitting diodes (LED) increased greatly (281%), from 1.5 million to 5.9 million households since SHEU-2011.
- Lightbulb time-of-use increases during the winter compared to the summer.
Text version
Figure 12: Usage of Types of Lightbulbs, 2015 (%)
| Type of Lightbulb | Uses | Does not use |
|---|---|---|
| Incandescent | 68 | 20 |
| Compact fluorescent | 47 | 42 |
| Halogen | 49 | 39 |
| Other fluroescent | 39 | 48 |
| LED | 41 | 47 |
| Other | 12 | 73 |